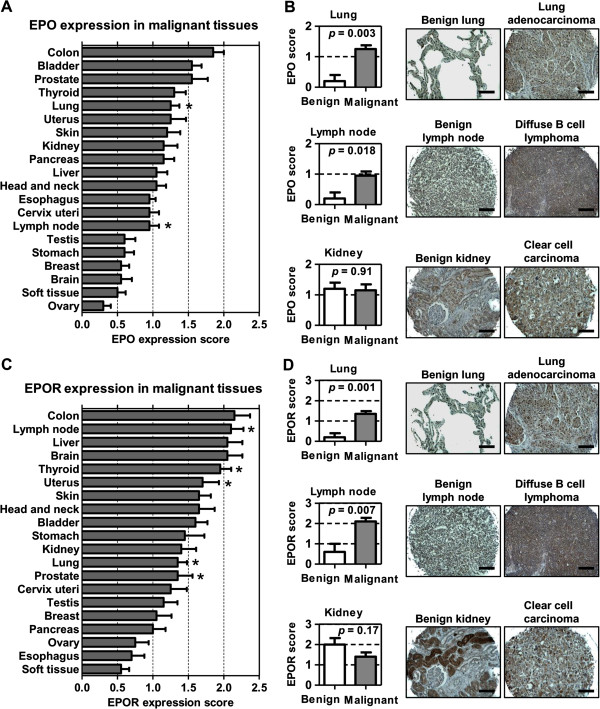
Figure 1.
Erythropoietin (EPO) and erythropoietin receptor (EPOR) expression in human malignancies. The expression scores of EPO (A) and EPOR (C) in 20 different malignancies are shown in a bar graph. The expression score (0 to 3) was quantified by combining the proportion and intensity scores. Asterisks indicate malignancies having a significant difference (p < 0.05) between malignant tissues and corresponding benign tissue. Representative images of EPO (B, right panels) and EPOR (D, right panels) immunostaining of normal lung, lymph node and kidney are illustrated with lung cancer, lymphoma and kidney cancer. Lung cancer and lymphoma, but not renal cell carcinoma, were noted to have an increase expression of EPO (B, left panels) and EPOR (D, left panels).

