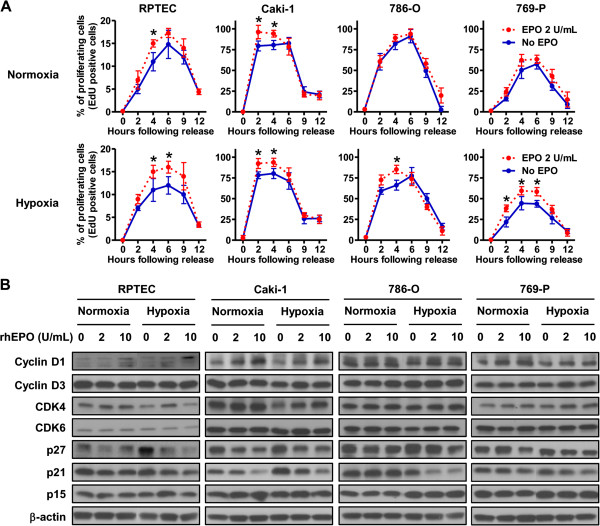
Figure 4.
Erythropoietin promotes S phase progression. A, Cells were synchronized in G0/G1-phase by using a double thymidine block and S-phase entry was monitored by the EDU incorporation following thymidine release. The percentage of proliferating cells at the indicated time after release was determined. The result of normoxia and hypoxia are shown in upper panels and lower panels, respectively. Asterisks indicate the significant difference (p < 0.05) between untreated cells (solid blue line) and rhEPO-treated cells (dashed red line). Data were represented as mean ± SD from three independent experiments. B, Cyclins, cyclin-dependent kinases and cyclin-dependent kinase inhibitors which are known to be keys for G1/S transition were analyzed by Western blot to monitor the association of the stimulation of EPO and transduction of cell cycle proteins. Renal cells were treated with the indicated concentrations of rhEPO for 24 hrs in normoxic and hypoxic condition. Cell lysates were subjected to Western blot analysis. β-actin was used as a loading control.

