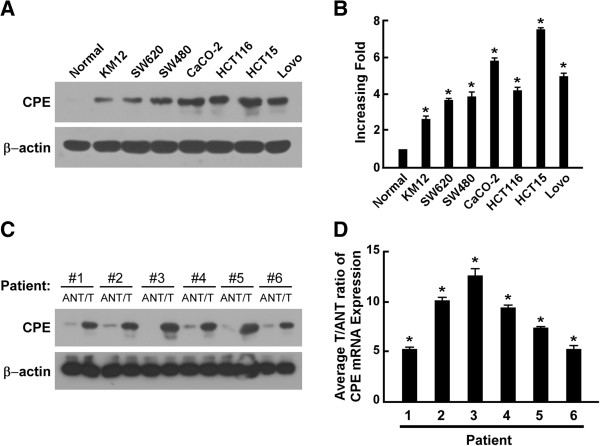
Figure 1.
CPE is overexpressed in colorectal cancer cells. (A-B) Western blot analysis (A) andreal-time qRT-PCR analysis (B) showing the relative expression of CPE in CRC cell lines and primary normal colorectal epithelial cells. (C-D) Western blot analysis (C) and real-time qRT-PCR analysis (D) showing the relative expression of CPE in CRC patients’ tumor tissues (T) vs. matched adjacent normal tissues (ANT); β-actin was used as a loading control. mRNA data were normalized to GAPDH control and are presented as mean ± standard deviation (SD) from three independent experiments. *: P < 0.05.

