
Figure 3.
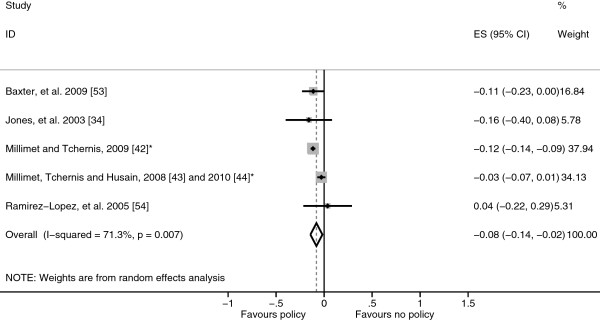
Forest plot showing body mass index standard deviation score effect sizes (Hedges’ g) of studies evaluating participation in the School Breakfast Program. *Study using the Early Childhood Longitudinal Study – Kindergarten (ECLS-K) cohort.
Official websites use .gov
A
.gov website belongs to an official
government organization in the United States.
Secure .gov websites use HTTPS
A lock (
) or https:// means you've safely
connected to the .gov website. Share sensitive
information only on official, secure websites.
Forest plot showing body mass index standard deviation score effect sizes (Hedges’ g) of studies evaluating participation in the School Breakfast Program. *Study using the Early Childhood Longitudinal Study – Kindergarten (ECLS-K) cohort.