Figure 4.

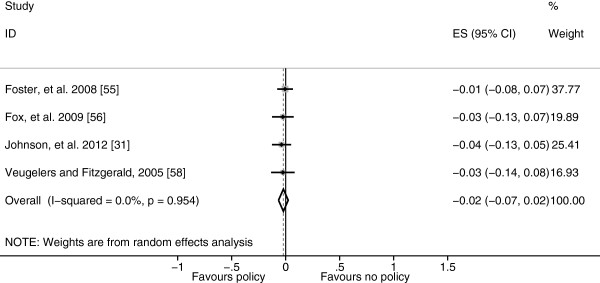
Forest plot showing body mass index standard deviation score effect sizes (Hedges’ g) of studies evaluating other diet related policies.

Forest plot showing body mass index standard deviation score effect sizes (Hedges’ g) of studies evaluating other diet related policies.