Figure 2.

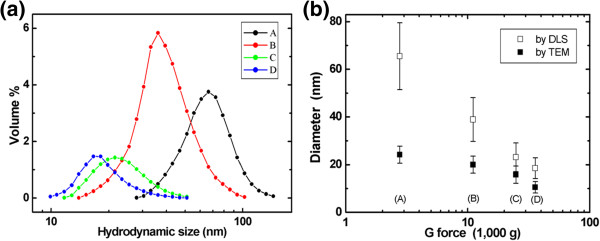
Relative size distributions of separated MNP groups and correlation between DLS and TEM results. Relative size distributions of separated MNP groups in aqueous solution measured by DLS (a) and a graph showing correlation between DLS and TEM results (b). The mean DLS diameters for the four groups, A to D, were 65.5 ± 14.0, 38.9 ± 9.1, 23.1 ± 6.0, and 18.5 ± 4.4 nm, respectively, with relative volumes of 29% (A), 49% (B), 12% (C), and 10% (D) as measured by integration of the DLS spectra.
