Figure 3.

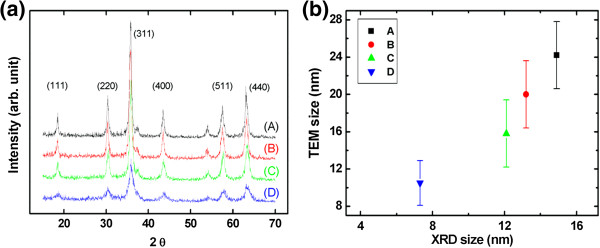
A stack plot of XRD patterns of MNPs and size calculation. The nanoparticles were well crystallized, and the peaks are in accordance with the typical CoFe2O4 XRD spectrum in which the main peaks are (111), (220), (311), (400), (511), and (440) (a). The mean diameters of the crystal particles calibrated from signal width for the four groups from A to D were 14.9, 13.2, 12.1, and 7.3 nm, respectively (b).
