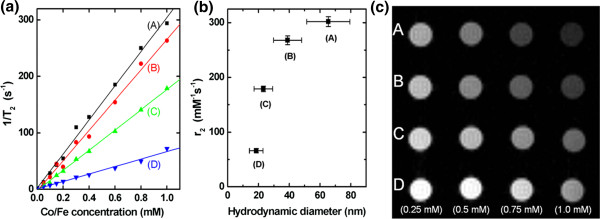
Figure 4.

Calculated T2relaxation rates and relaxivity and representative MR image for the four groups. Concentration-dependent T2 relaxation rates (1/T2) (a), calculated T2 relaxivity r2(b) for the four groups at 4.7 T (200 MHz for protons), and representative MR image (c) for the four groups depending on the Co/Fe concentration. The slopes of the fitted lines provide the T2 relaxivity (r2) at the concentration of 1 mM for each group; the values are 302 ± 9, 268 ± 8, 179 ± 5, and 66 ± 4 mM−1s−1 for groups A, B, C, and D, respectively. A representative T2-weighted MR image (TE/TR = 10/10,000 ms, slice thickness = 2 mm, number of scans = 2), obtained by a conventional spin-echo pulse sequence on a 4.7-T MRI system, from the samples with four different Co/Fe concentrations (0.25, 0.5, 0.75, and 1.0 mM) for the groups A to D is shown (c). The signal decrease due to T2 negative contrast is higher with increasing particle size and increasing Co/Fe concentration, especially for group A, which is in accordance with the result shown in (a).
