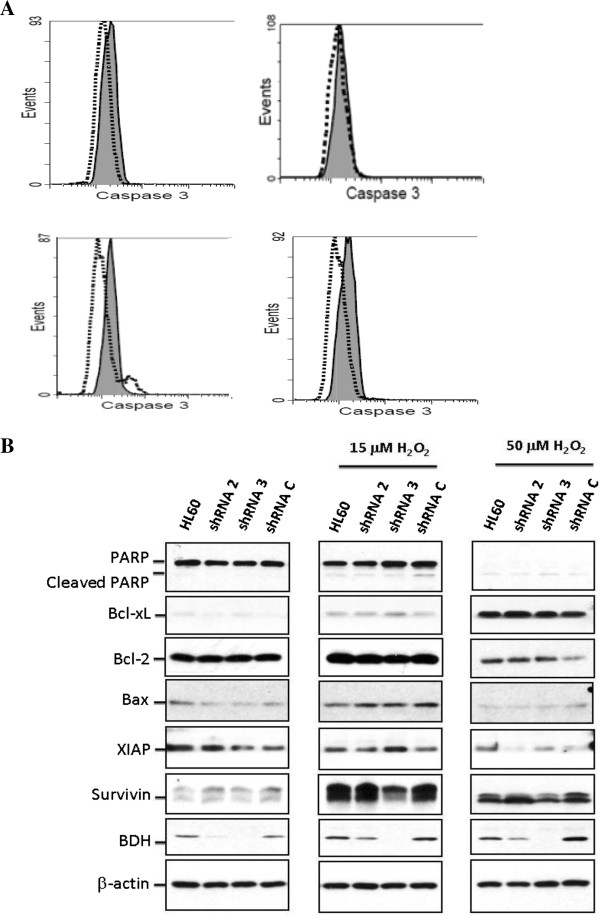
Figure 4.
Caspase-3 activity after treatment with 50 μM H2O2 for 2 h in the HL60 cell line. A) Cleaved caspase-3 detected by flow cytometry. The gray area represents cells that were not subjected to the H2O2 treatment, and the dot- lines denote cells treated with H2O2. Top left: parental HL60; top right: shRNA-BDH2-2 HL60; bottom left: shRNA-BDH2-3 HL60; bottom right: shRNA control vector HL60. B) Bcl-2, Bcl-xL, BAX, PARP, survivin, XIAP, and BDH2 protein expression on a western blot analyses.

