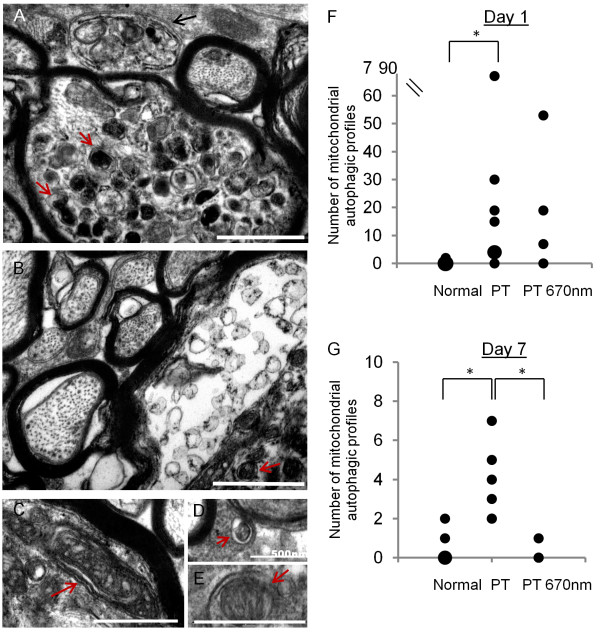
Figure 5.
Mitochondrial autophagic profiles in ON vulnerable to secondary degeneration +/− R/NIR-IT. Accumulations of mitochondrial autophagic profiles (red arrows) were seen especially at day 1 after PT (A, B). Occasionally, larger features reminiscent of autophagosomes were observed (A, black arrow) and parts of the nerve appeared highly abnormal (*, B). Further representative images of mitochondria (identified by their double membrane) enveloped by an additional double membrane (C, D, E, red arrows, classified as mitochondrial autophagic profiles) are shown; scale bar = 1 μm unless otherwise stated on image. Number of mitochondrial autophagic profiles at day 1 (F): each black dot represents one animal, and larger dots represent a higher frequency of that particular number of observations. There were significantly more observations of mitochondrial autophagic profiles at day 1 after PT injury compared to normal, which was not significantly altered by R/NIR-IT. At day 7 there was an increased incidence of mitochondrial autophagic profiles compared to normal and the incidence was decreased following R/NIR-IT (G). Note that for this outcome, no distinction between glia and axons was made, due to the number of mitochondrial autophagic profiles in glia being very low. *Significantly different at p ≤ 0.05.

