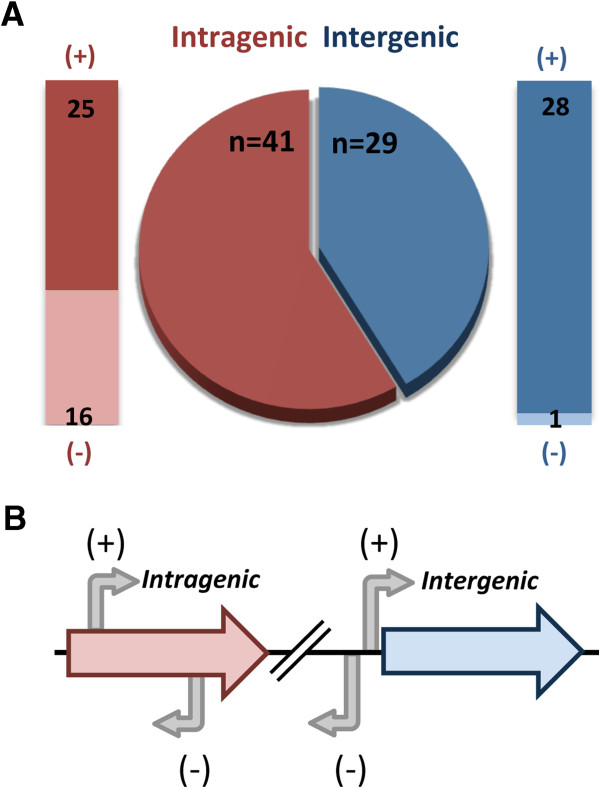
Figure 2.
Binding sites predicted by ChIP-chip analysis. A) Location of the predicted binding sites for the 70 ORFs enriched by α-σ54 pulldown. Outer bars represent further breakdown by location and orientation of the binding site relative to the enriched ORF, as diagrammed in (B). A (+) indicates that the binding site is in the same orientation as the ORF while (−) indicates that the binding site is in the opposite orientation as the enriched ORF.

