Figure 6.

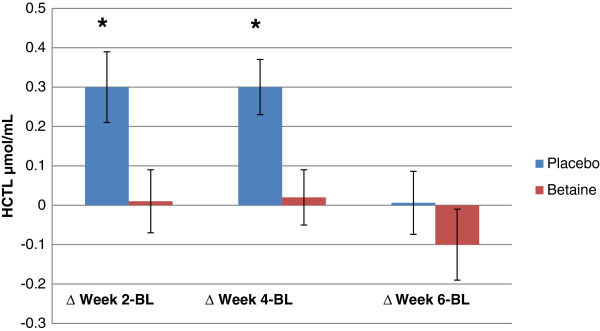
Changes in urinary homocysteine thiolactone values for placebo (n = 12) and Betaine (n = 11) between baseline and three time intervals. Note: * = Significantly (p < .05) different than betaine.

Changes in urinary homocysteine thiolactone values for placebo (n = 12) and Betaine (n = 11) between baseline and three time intervals. Note: * = Significantly (p < .05) different than betaine.