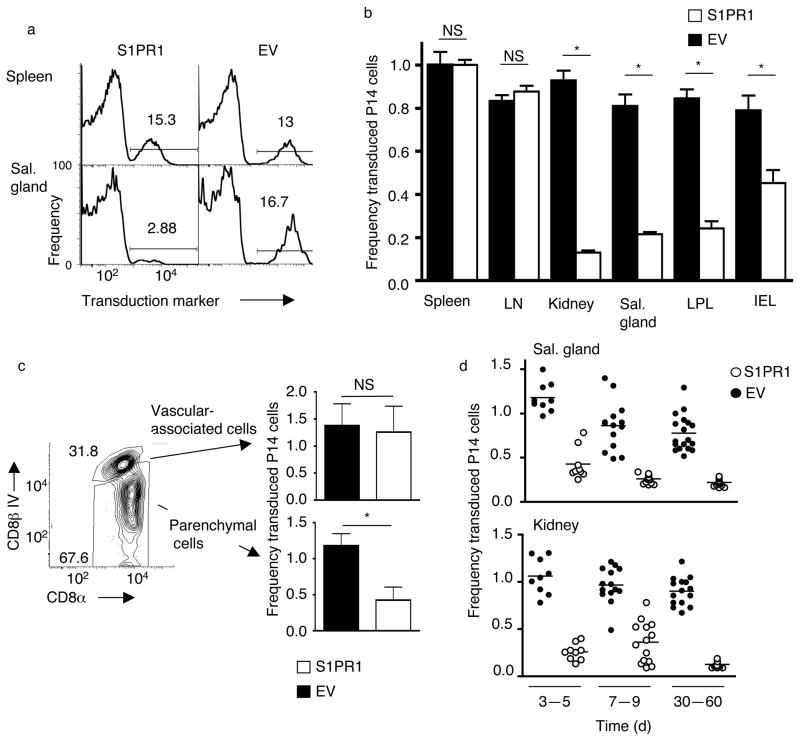
Figure 4. Forced S1PR1 prevents establishment of TRM.
Activated P14 CD8+T cells were transduced with retroviral vectors encoding S1PR1 and the transduction marker Thy-1.1 (“S1PR1”) or Thy-1.1 alone (Empty vector; “EV”) (see Supplementary Fig. 4a). Congenically distinct S1PR1 and empty-vector transduced cells were co-transferred into recipients subsequently infected with LCMV. (a) Histograms (representative of n=12 from 4 independent experiments) showing the frequency of cells expressing the transduction marker from the indicated retroviral vector, for P14 CD8+ T cells cells isolated from spleen and salivary gland >30 days post LCMV infection. (b) Transduction frequency of P14 CD8+ T cells, transduced with empty vector (black bars) or S1PR1 vector (white bars) in the parenchyma of the indicated tissues, 28–60 days post LCMV. Data are normalized to the percent transduction for the spleen from the same animal. Graphs show mean +/− SEM for 11–18 samples per group, compiled from at least 4 independent experiments. (c) Relative transduction for S1PR1 (white bars) or empty vector (black bars) transduced P14 CD8+ T cells present in vascular-associated versus tissue parenchyma of the salivary gland, isolated 5 days after LCMV infection. Bar graphs are compiled from 3 independent experiments (n=9). (d) Frequency of transduction (relative to spleen) of empty vector (black) versus S1PR1 (white) transduced P14 cells from kidney and salivary gland, at indicated time points following LCMV infection. N=9–18 from at least 3 independent experiments. Similar time-course trends were observed for other NLTs (data not shown). In all panels, analysis gated on live P14 CD8+ T cells, and (except panel c) with exclusion of vascular-associated cells. Statistical significance in this figure is indicated as follows: *, p<0.001; NS, p>0.05.

