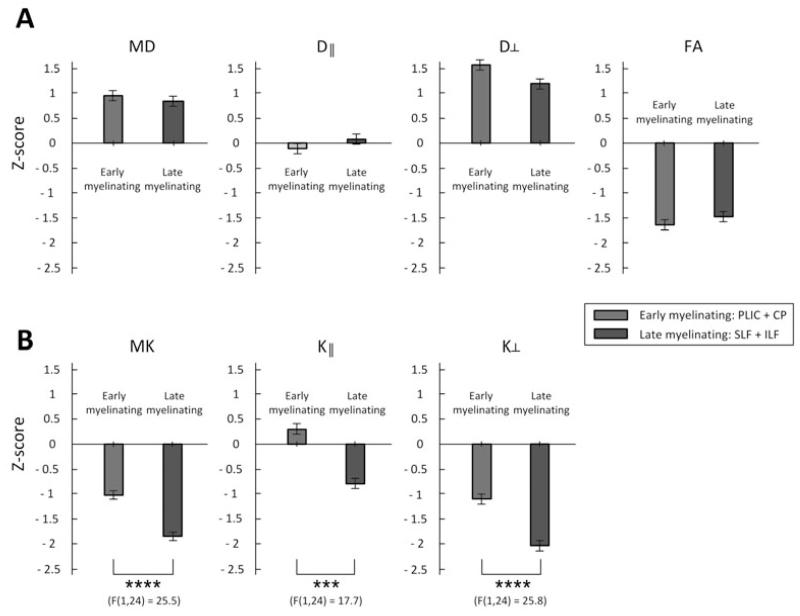
Figure 3.
Comparisons of Z-scores (deviation from the mean of normal controls) in the early- and late-myelinating fiber tracts of the MTLE group; *: p < 0.05, **: p < 0.01, ***: p < 0.001, ****: p < 0.0001, evaluated with a repeated measure ANOVA (one factor). Error bars represent the standard error.

