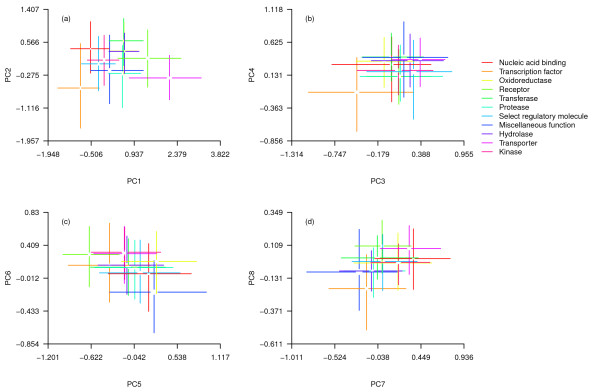
Figure 3.

a-d proteomic composition of different functional groups of proteins within 12 Drosophila proteomes (lines, interquartile range; central gaps, 95% confidence intervals around the median). Axes are the same as in Figure 1.

a-d proteomic composition of different functional groups of proteins within 12 Drosophila proteomes (lines, interquartile range; central gaps, 95% confidence intervals around the median). Axes are the same as in Figure 1.