Figure 4.

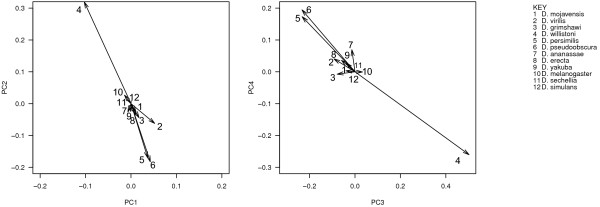
Biplot showing mean divergence in proteomic composition since the most recent ancestor for 12 species of Drosophila. Ancestral values are standardized at the origin for comparison. Axes are the same as in Figure 1.

Biplot showing mean divergence in proteomic composition since the most recent ancestor for 12 species of Drosophila. Ancestral values are standardized at the origin for comparison. Axes are the same as in Figure 1.