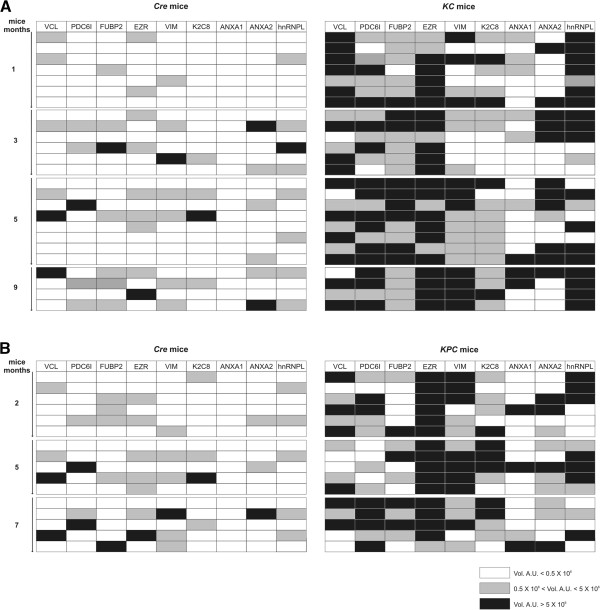
Figure 2.
Individual KC and KPC serum reactivity against the identified antigens. The intensity of reactivity of each control Cre, KC (A) and KPC (B) serum against each MALDI-TOF MS identified protein is represented as a gray gradient scale of color as described in the legend. The volume (Vol) of each immunoreactive spot was calculated after background subtraction with the image analysis software “ProFinder 2D” and reported as arbitrary units (AU). For proteins represented from more than one spot the volume was expressed as mean AU value.

