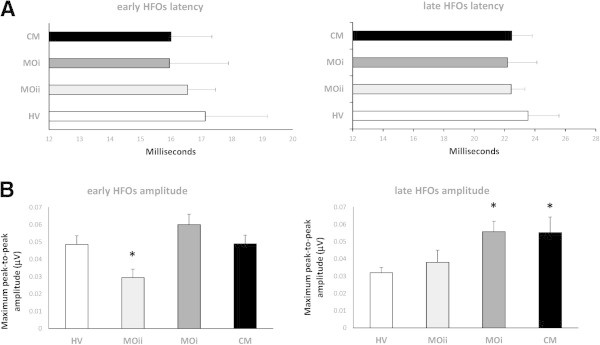
Figure 3.

High-frequency oscillations (HFOs) latency of the negative oscillatory maximum (A) and maximum peak-to-peak amplitude (B), separately on the early (left panel) and late (right panel) HFO bursts (data expressed as mean ± SEM). (*P < 0.05 vs. HV).
