Fig 1.

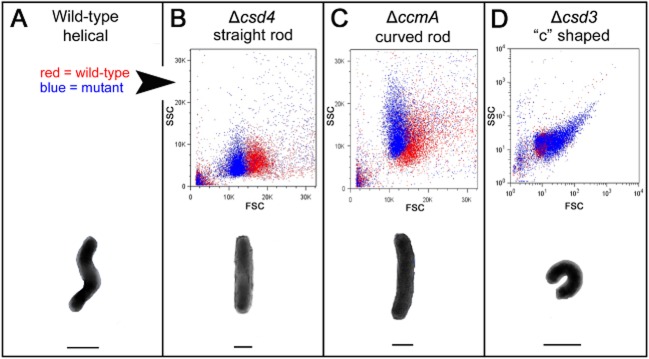
Flow cytometry distinguishes wild-type H. pylori cells from three classes of cell shape mutants.
B–D. (Upper) Scatter plots of each mutant (blue) are overlaid with wild-type plots (red) generated in the same experiment for comparison; however, not all mutants were analysed in the same experiment. Forward scatter is shown on the x-axis (FSC) and side scatter on the y-axis (SSC). Note that the axes in (D) are displayed in log scale to show the full range of spectral properties observed with the csd3 mutant population.
A–D. (Lower) Illustration of the characteristic morphology of each strain/shape class. Lines drawn below each cell indicate its bulk width, which may contribute to the observed differences in forward scatter. Images of cells in the schematic are not to scale. Strains used: NSH57, LSH18, KGH10, LSH112.
