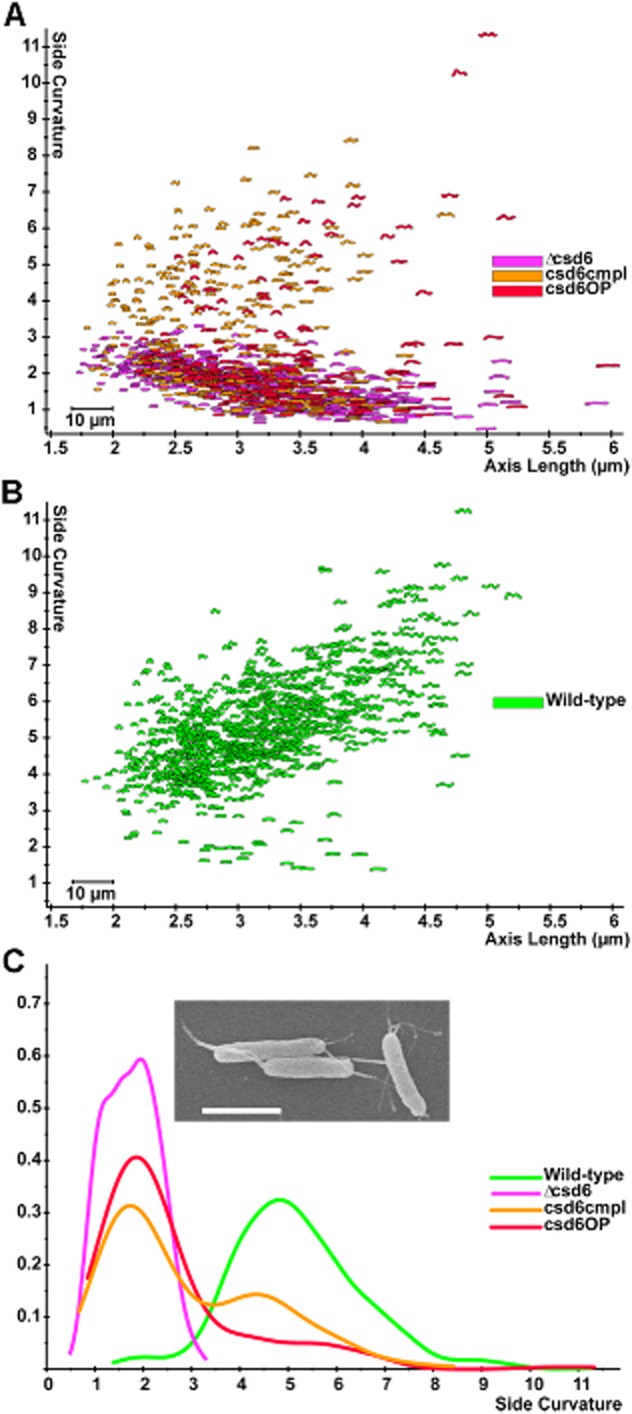
Fig 2.

Loss or overexpression of csd6 perturbs cell shape.A and B. Scatter plot arraying cell length (x-axis, μm) and cell curvature (y-axis, arbitrary units). Each point depicts the outline of the cell image obtained by phase-contrast microscopy.
C. Smooth histograms (kernel density estimate) displaying population cell curvature (x-axis, arbitrary units) as a density function (y-axis); inset SEM image of csd6 mutant. Scale bar = 2 μm. csd6 mutant (Δcsd6), complemented (csd6cmpl) and merodiploid (csd6OP). Strains used: LSH100, TSH17, TSH31, TSH35.
