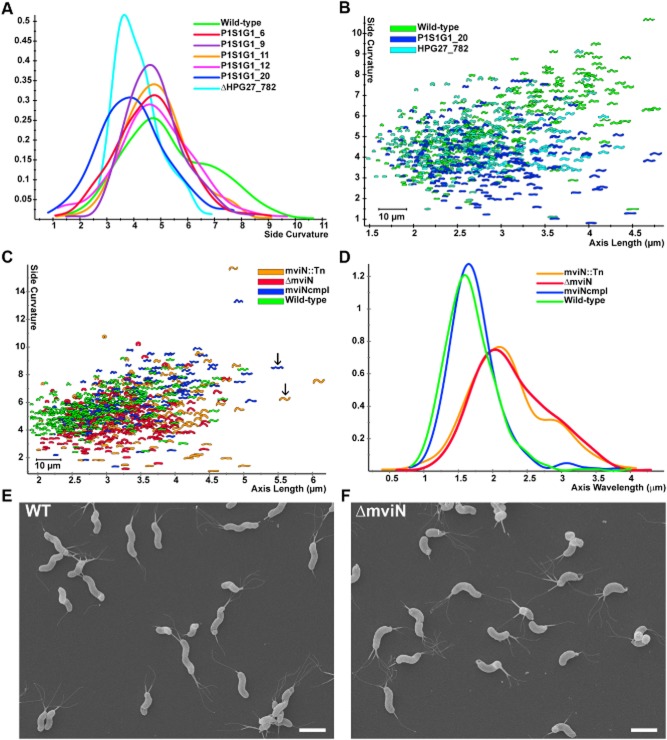
Fig 3.
HPG27_782 and mviN mutants show subtle morphological changes.
A. Smooth histograms displaying population cell curvature (x-axis, arbitrary units) as a density function (y-axis) for wild-type, selected clones from the low FSC FACS sorted population and HPG27_782 null allele.
B and C. Scatter plots arraying cell length (x-axis, μm) and cell curvature (y-axis, arbitrary units). Each point represents the outline of the cell image obtained by phase-contrast microscopy.
B. Comparison of wild-type to HPG27_782 transposon or null mutant strains.
C. Comparison of wild-type to mviN transposon, null and complemented mutant strains. Arrows indicate mviN mutant and complemented cells with similar axis length but different wavelength.
D. Smooth histograms displaying population axis wavelength (x-axis, μm) as a density function (y-axis).
E and F. Scanning electron microscope images of wild-type and mviN mutant bacteria. Scale bar = 2 μm. Strains used: NSH57, P1S1G1_6, P1S1G1_9, P1S1G1_11, P1S1G1_12, P1S1G1_20, MHH17, LSH100, P4S1G1_29, TSH1, TSH13.

