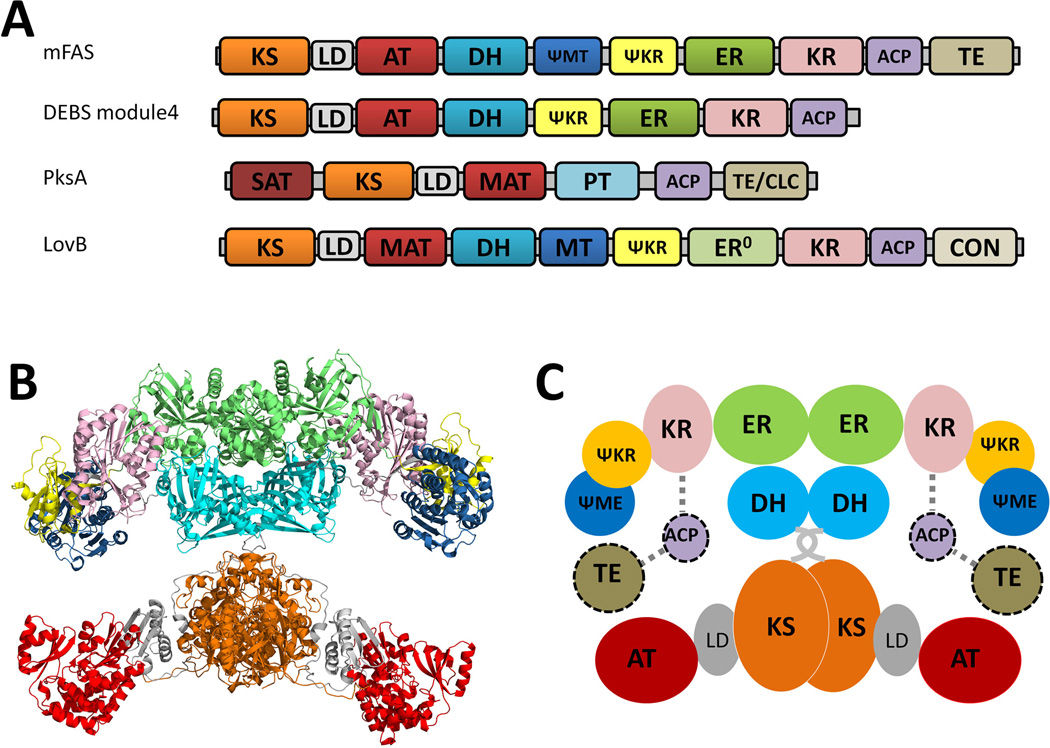
Figure 5.
Structural overview of mammalian FAS. (A) Comparison of the linear organizations of mFAS and type I PKSs. (B) The crystal structure of mFAS with a resolution of 3.2 Å. PDB code: 2VZ9 (C) Cartoon representation of the mFAS organization with predicted ACP-TE domains. 215×157mm (300 × 300 DPI).

