
Figure 5.
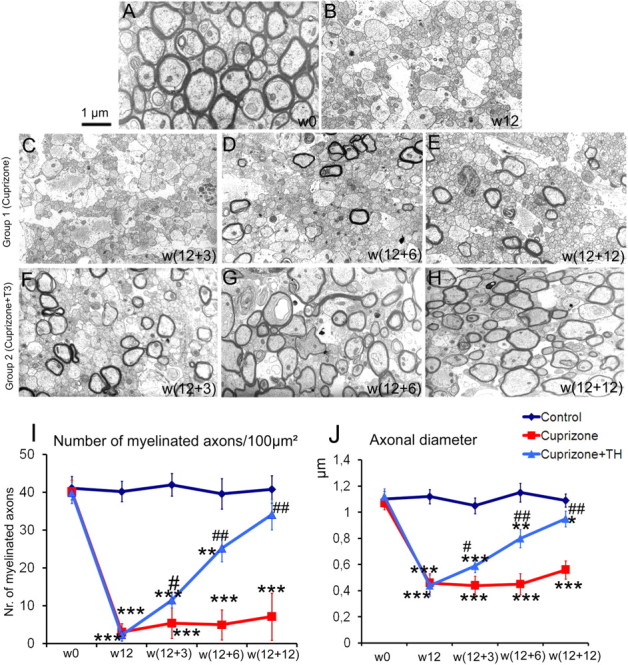
Representative electron micrographs of the mouse corpus callosum. A, At w0, before cuprizone treatment, well myelinated axons are observed. Similar electron micrographs were obtained from sections of control mice at each time point (data not shown). B, After 12 weeks of cuprizone insult (w12), most axons are demyelinated and have small caliber. Scale bar, 1 μm. C–E, Failure of consistent remyelination is quantified after cuprizone withdrawal in mice belonging to group 1 at w12 + 3 (C), w12 + 6 (D), w12 + 12 (E). F–H, Important progressive recovery in both, number of myelinated axons and myelin thickness is evident in the corpora callosa of mice from group 2 (that received T3 hormone), at w12 + 3 (F), w12 + 6 (G), and w12 + 12 (H). I, Number of myelinated axons/100 μm2 counted in semithin sections of the corpus callosum in animals from groups 1 and 2, at each experimental time point. J, Axonal caliber measurements performed on electron micrographs acquired from the corpus callosum region of mice from groups 1 and 2, at each experimental time point. * represents the statistical significance (*p < 0.05, **p < 0.01, ***p < 0.001) versus the control group, while # expresses the statistically significant differences (# p < 0.05, ## p < 0.001) among groups 1 (cuprizone treatment) and 2 (cuprizone plus T3 treatments).