
Figure 10.
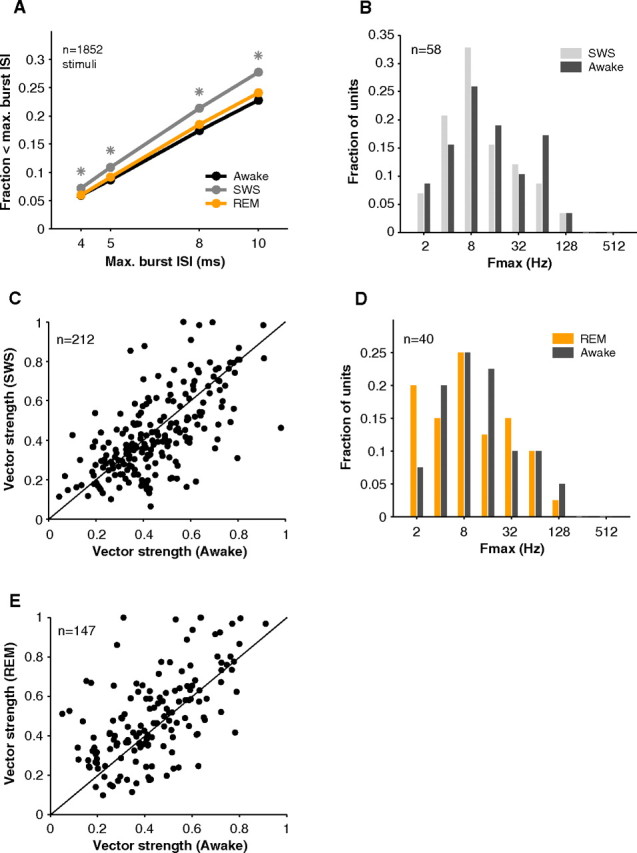
Bursting and stimulus synchronization in sleep. A, Neurons tended to be burstier (fraction of interspike intervals < maximum ISI) in SWS. Awake and REM spike trains had similar burst fractions. Asterisks represent significance at the p < 0.001 level in comparison of SWS to awake and REM (Wilcoxon rank sum, n = 1852 stimuli). B, Comparison of upper limit of stimulus synchronization (Fmax) in awake (dark gray) and SWS (light gray). In general, neurons were able to follow up to similar repetition frequencies in both states (mean Fmax awake = 14.0, SWS = 11.6 Hz, p = 0.37, Wilcoxon rank sum, n = 58). C, Vector strengths in awake and SWS were comparable (mean VS awake = 0.45, SWS = 0.43, p = 0.11, Wilcoxon rank sum, n = 212). D, Fmax distributions were similar in awake and REM (mean awake = 12.7, REM = 10.2 Hz, p = 0.46, Wilcoxon rank sum, n = 40). E, Vector strength in REM was similar to that in awake (mean VS awake = 0.44, REM = 0.49, p = 0.07, Wilcoxon rank sum, n = 147).