
Figure 6.
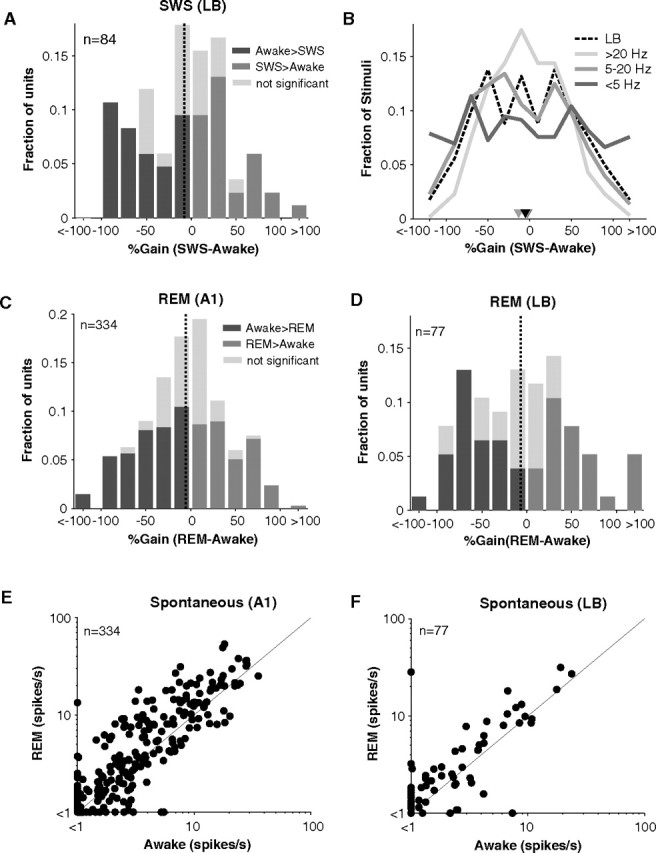
Stimulus-driven and spontaneous activity in LB during sleep. A, Histogram of %Gain (SWS-awake) for cells recorded in LB (n = 84). Mean gain = −8% (vertical dotted line). Same format as Figure 3A. B, Control for effects of firing rate in comparing A1 and LB. Dividing the A1 data into low (0–5 Hz), middle (5–20 Hz), and high (>20 Hz) firing rates yielded three gain distributions of near-identical medians (−3%, −13%, and −4% respectively) (inverted triangles) but increasing variance (SD = 72%, 54%, 43%). The gain distribution was tightest for high firing rates. The distribution for LB (black, dashed line) fell on the A1 distribution for intermediate firing rates (5–20 Hz) consistent with LB rates averaging 8 Hz. C, D, Gain histograms in REM for A1 (C) and LB (D). Mean gain = −5% (A1) and −7% (LB) (vertical dashed lines). E, F, Scatter plots of spontaneous firing rates in A1 (E) and LB (F). Although a trend toward higher REM spontaneous rates appears to be present, spontaneous rates were not significantly different from those in awake whether in A1 or LB (pA1 = 0.23, pLB = 0.31, Wilcoxon rank sum, nA1 = 334, nLB = 77).