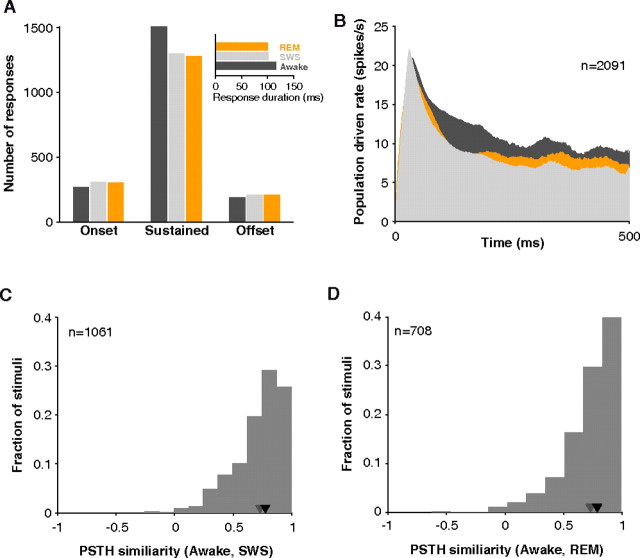
Figure 9.
Response patterns observed in sleep. A, The number of sustained responses dropped slightly in sleep (SWS or REM) as reflected in the shorter average duration of detected responses (inset). B, Population response profiles for all stimuli tested in awake, SWS, and REM. Population PSTH was obtained by averaging, without normalizing, all responses during their respective driven windows. Responses were long-lasting in all three states. C, The distribution of similarity values (Pearson's product–moment correlation coefficient) between PSTH profiles in awake and SWS. Response patterns were highly correlated (median = 0.78, n = 1061; black inverted triangle) especially when compared with correlation attainable using odd and even trials from the same state (gray triangle). D, The distribution of similarity values between PSTH profiles in awake and REM. Response patterns were highly correlated (median = 0.79, n = 708; black inverted triangle).

