
Figure 3.
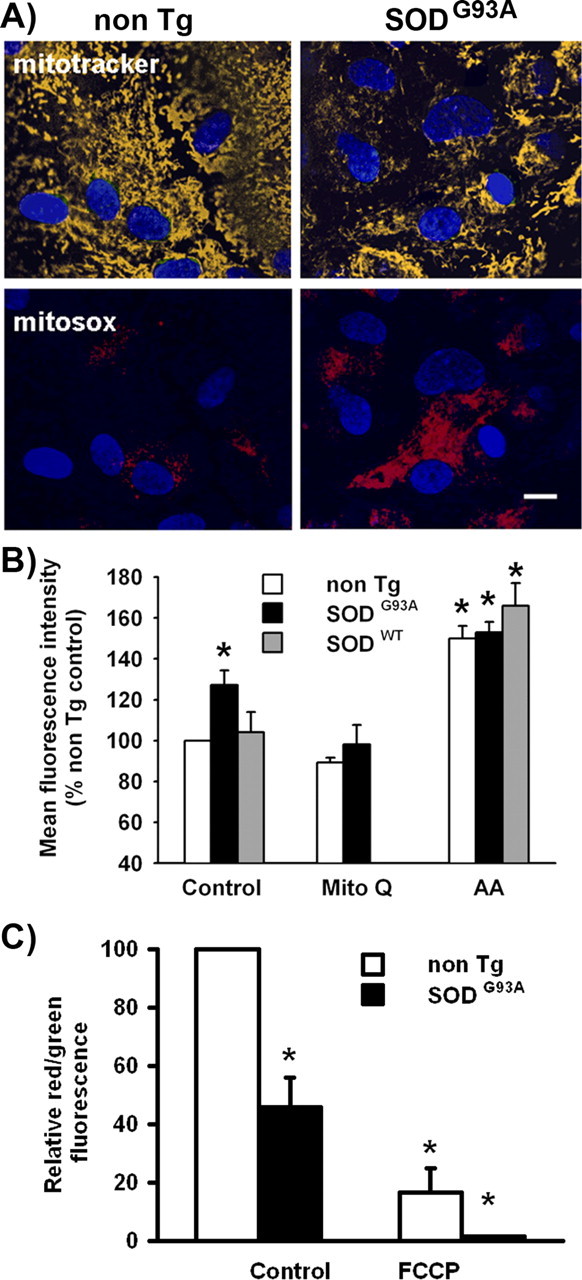
Increased superoxide generation and decreased mitochondrial membrane potential (ΔΨ) in SOD1G93A astrocytes. A, Fluorescence micrographs of cultured astrocytes with MitoTracker Deep Red (top row, yellow) and MitoSOX Red (bottom row, red). Astrocyte monolayers were treated as indicated in Materials and Methods. Nuclei are stained with DAPI (blue). Scale bar, 100 μm. B, Data are mean fluorescence intensity of MitoSOX Red emission measured by flow cytometry in nontransgenic (white bars), SOD1G93A (black bars), or SOD1WT (gray bars) astrocyte cultures treated for 24 h with Mito-Q or antimycin A as positive control. Data are mean ± SEM from three independent determinations. *p < 0.05, significantly different from non-Tg control. C, Mitochondrial membrane potential as a ratio of the fluorescence of aggregate and monomer forms of JC-1 in SOD1G93A (black bars) and nontransgenic (white bars) astrocytes in control and after addition of the uncoupler FCCP. These values were expressed in a percentage scale, with the red/green fluorescence ratio values of nontransgenic astrocytes (3.7 ± 0.30) considered as 100% and the red/green fluorescence ratio values of FCCP-treated transgenic astrocytes considered as 0%. Data are mean ± SEM from three independent experiments. *p < 0.05, significantly different from non-Tg control.