Figure 3.
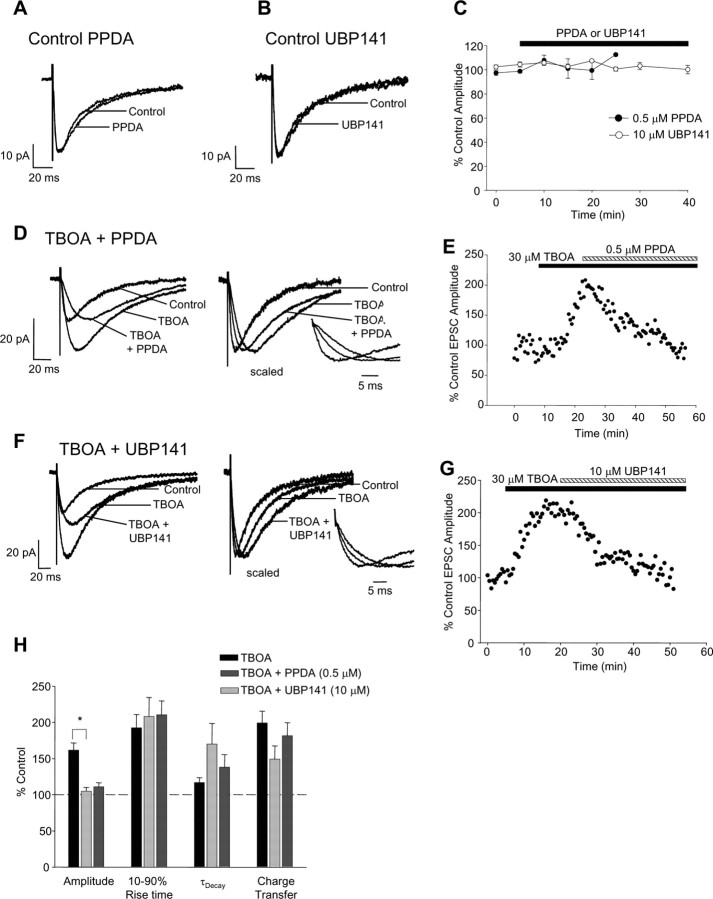
NR2D-containing extrasynaptic NMDARs are activated when glutamate uptake is inhibited. A, Traces showing no effect of 0.5 μm PPDA on control NMDAR-EPSCs. B, Traces showing no effect of 10 μm UBP141 on control NMDAR-EPSCs. C, Graph of NMDAR-EPSC amplitude during incubation with 0.5 μm PPDA (filled symbols; n = 9) and 10 μm UBP141 (open symbols; n = 4). D, Traces showing PPDA inhibition of the TBOA enhancement of NMDAR-EPSCs, inset illustrates EPSCs on an expanded timescale. E, Representative experiment showing the PPDA inhibition of the TBOA enhancement of NMDAR-EPSCs. F, Traces showing the UBP141 inhibition of the TBOA enhancement of NMDAR-EPSCs, inset illustrates EPSCs on an expanded timescale. G, Representative experiment showing the UBP141 inhibition of the TBOA enhancement of NMDAR-EPSCs. H, Bar graph illustrating mean percentage changes in NMDAR-EPSC properties with TBOA alone (n = 17), TBOA + PPDA (n = 5) and TBOA + UBP141 (n = 4). *p < 0.05, ANOVA plus post hoc Tukey's test.

