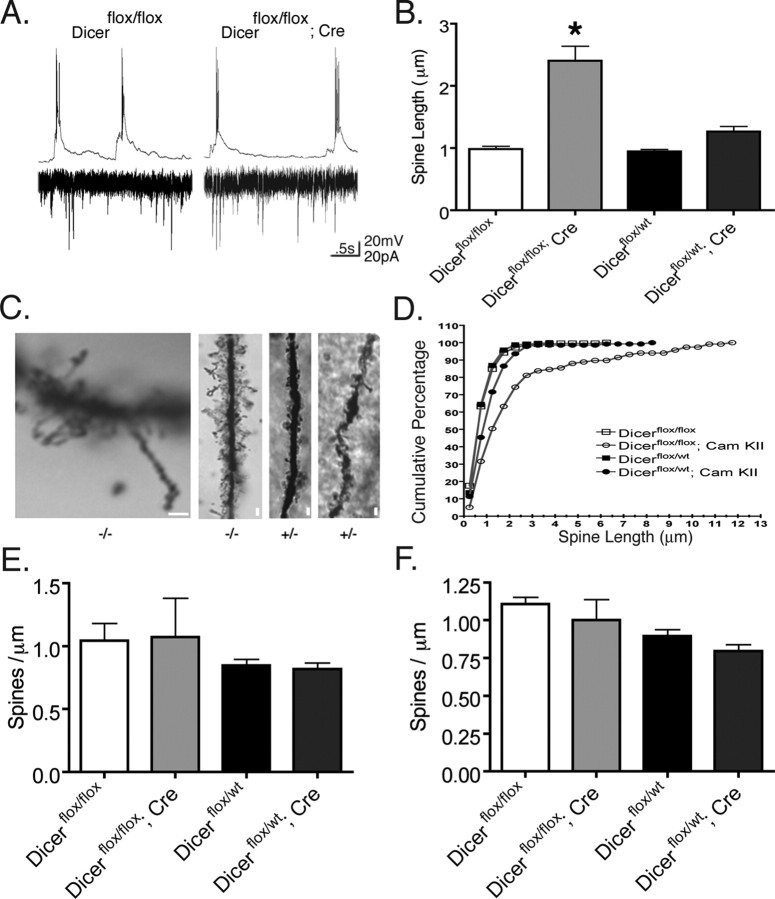
Figure 6.
Inactivation of Dicer in hippocampal CA1 neurons leads to increased apical dendritic spine length but not density in vivo. A, Spontaneous action potentials and synaptic activity from Dicer mutant animals at postnatal day 15 indicate that dendritic spines are functional. B, Mean dendritic spine length for Dicerflox/flox, 0.98 ± 0.04 (n = 245, N = 2); Dicerflox/flox; CaMKII +/−, 2.40 ± 0.23 (n = 117, N = 2); and Dicerflox/wt, 0.94 ± 0.03 (n = 236, N = 3); Dicerflox/wt; CaMKII +/−, 1.26 ± 0.08 (n = 141, N = 3). C, Example of dendritic spines in Dicerflox/flox; CaMKII +/− Cre −/−, and Dicerflox/wt; CaMKII +/− Cre +/− animals. Dendritic spines of Dicerflox/flox; CaMKII +/− Cre (as shown in C, left) were observed up to 12 μm in length. D, Cumulative distribution of apical dendritic spine length in each Dicer genotype. Loss of microRNAs results in one-third of dendritic spines being greater in length than the longest measured dendritic spine in other Dicer genotypes. E, F, Basal and apical dendritic spine density in CA1 hippocampal neurons at postnatal day 21 in Golgi-stained neurons. The number of spines per 50 μm dendrite were counted by three blind observers, and the numbers were averaged. Criterion for inclusion included dendrites of 75 μm or longer. For analysis, spines were counted on basal or apical dendrites starting 25 μm from the cell body for a length of 50 μm. Analysis performed on two to three dendrites per cell in each condition with four to five cells measured. Three to four animals were used per condition. N is the number of animals, and n the number of cells. Scale bars, 2 μm. Error bars represent SEM. Values in B are statistically significant (*p < 0.001) using a one-way ANOVA with a Tukey's post test.

