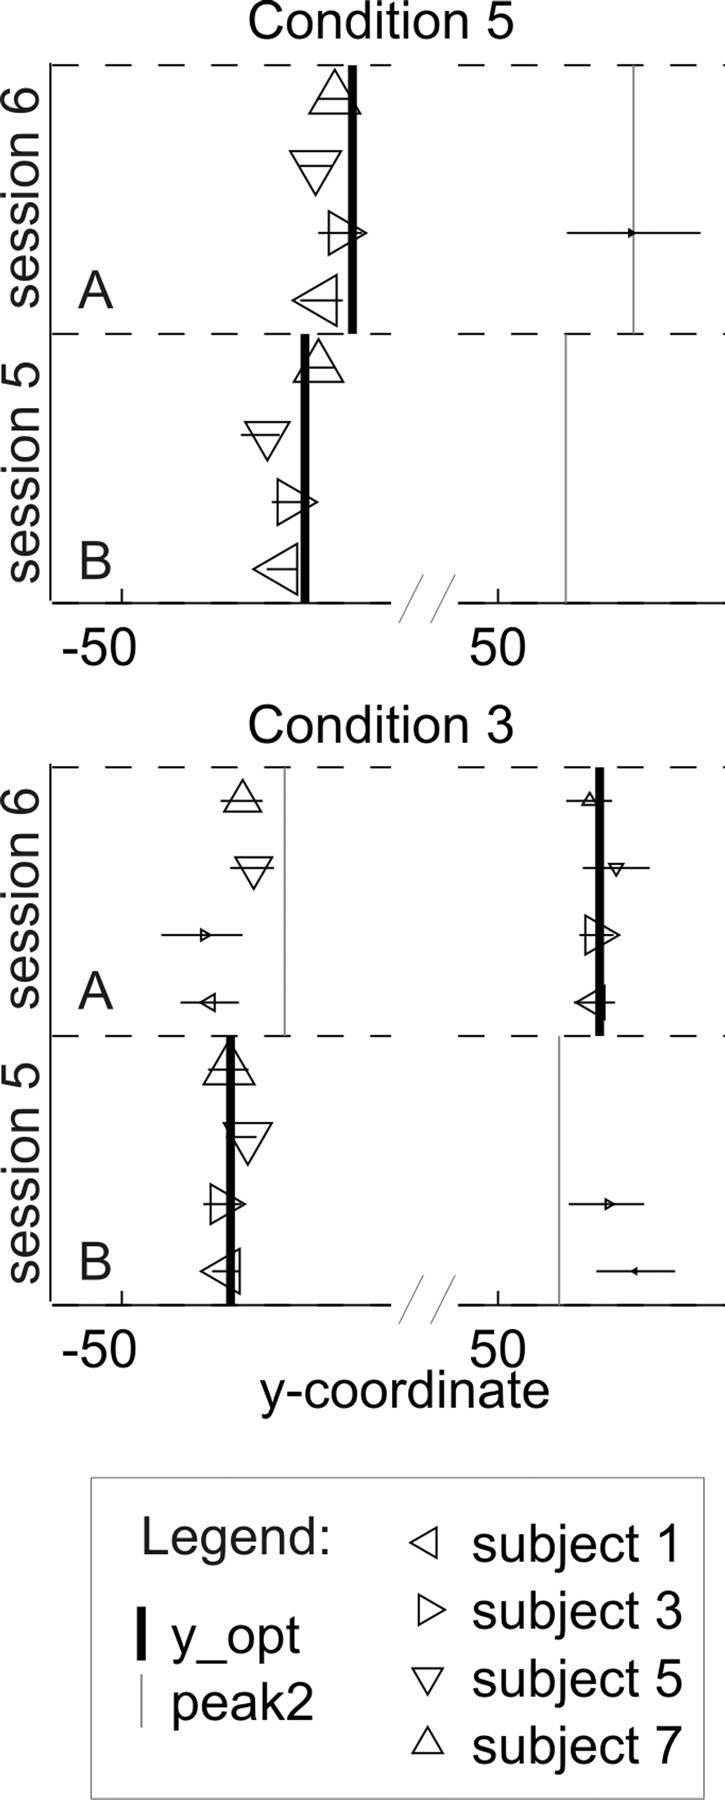
Figure 10.

Aim points of one group of subjects before and after the switch of the cost function, in conditions 5 and 3 of experiment 2, plotted for direct comparability. The y-coordinates of the individual aim points were divided by the subject's endpoint variability in the session, so that all aim points can be shown in the same plot, although goals were scaled to each subject's endpoint variability. Marker size is scaled to the number of endpoints in the cluster around the respective aim point. The x-axis is broken to show aim points on both sides of the middle defender in the same plot. The positions of the subject symbols on the y-axis are arbitrarily chosen. Horizontal error bars indicate ±1 SEM estimate. This figure shows that, as task versions changed, subjects followed the slight shift of the optimal aim point within a game in condition 5. They did not fully follow the switch of the optimal aim point from one side of the middle defender to the other that was induced by the change in the cost function in condition 3. All subjects did, however, shift some of their endpoints to the new optimal aim point.
