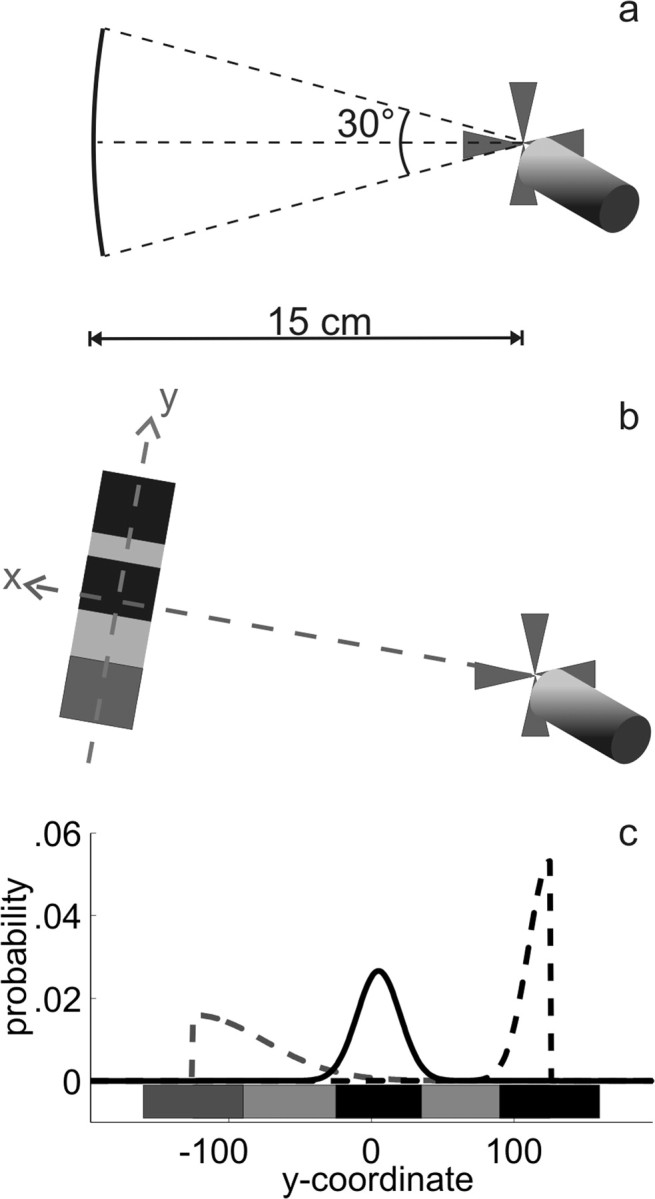
Figure 2.

Stimuli. a, Each trial started when the subject touched a red starting cross at the right side of the display. The movement target (the goal) then appeared 15 cm from the starting point, centered on a randomly chosen position on the arc shown here. b, The rectangular dark red target (here, light gray) was accompanied by three rectangular defenders, the color of which indicated their “jump abilities” (see c). We will refer to the axis connecting starting position and target center as the x-dimension and the perpendicular axis in the table plane as the y-dimension. c, Jump distributions of the three defenders, superimposed on a sketch showing their starting positions in a standard size goal. Condition 1 is shown: the middle defender is at its leftmost starting position. In the other conditions, the middle defender and its jump distribution were closer to the right one. The jumps of the bright-red (here, black) defenders were drawn from Gaussians with a SD of 15 mm, and the jumps of the blue (here, dark gray) defender were drawn from a Gaussian with a SD of 50 mm. The jump distributions of the defenders at the goal borders were folded, so that jumps always went toward goal center, not away from it. Note that all measures given here (and in the following figures, whenever the x-axis shows y-coordinate without an explicit metric) are standard measures. The actual measures depended on subjects' SDs in the baseline task, according to which we scaled the stimuli as well as the parameters of the jump distributions. Because we chose the parameters to provide meaningful conditions given a standard endpoint variability of 10 mm in y-direction and subjects' endpoint variability in y-direction was usually four or five times smaller than that, the stimuli presented in the experiments were about four or five times smaller than our standard scale suggests.
