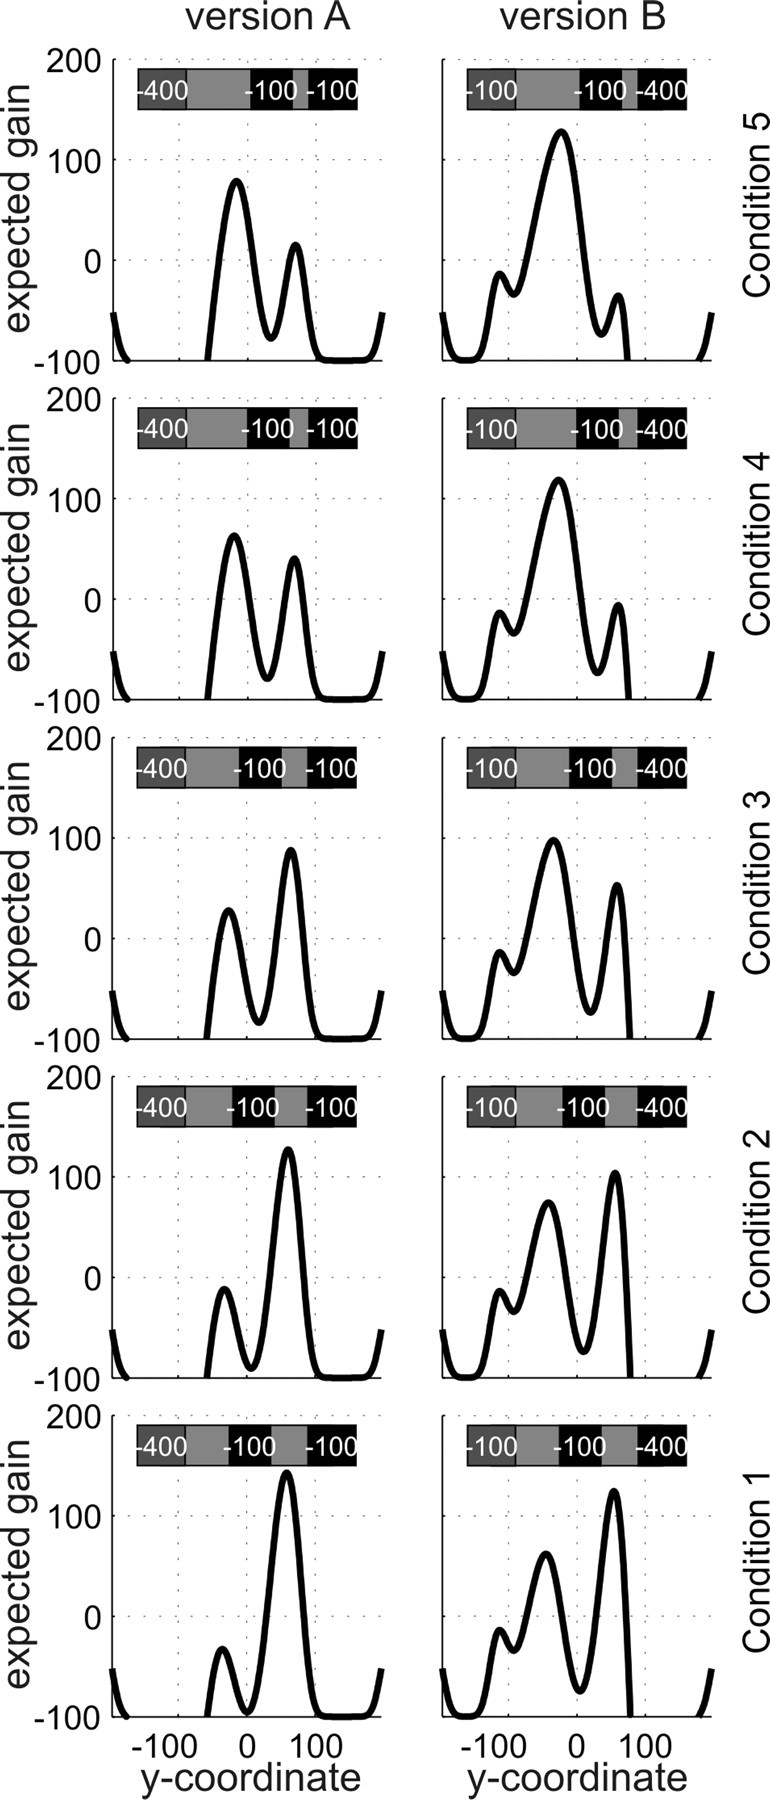
Figure 6.

Gain landscapes in all five conditions and both versions of experiment 2. Conventions are as in Figure 3. As can be seen in the stimulus sketch in the top part of each panel, the two versions only differed in which of the defenders bore the higher penalty, but not in the starting positions of the defenders. Penalty values are printed on defenders only for illustrative reasons and were not there during the experiment. Instead, the −400 defender had a grim face, and the −100 defenders had smiling faces. A comparison of the expected gain landscapes in the left and right columns shows that changing the penalties from one version of the task to the other resulted in slight shifts of the peaks (barely visible at this scale) and affected the relative height of the local maxima such that in condition 3 the global maximum changed from one peak to the other.
