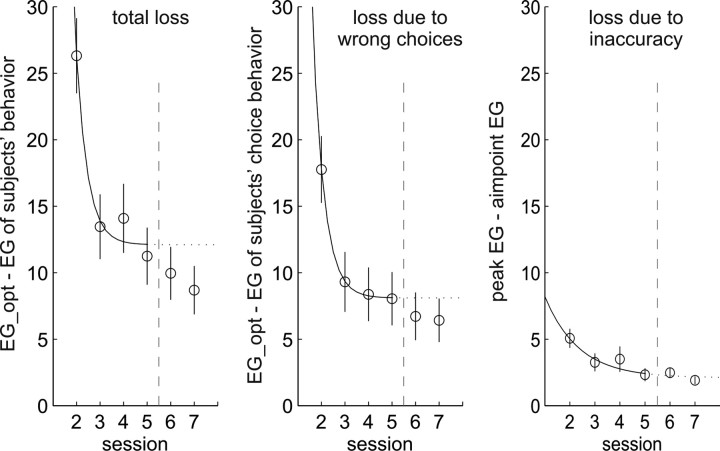
Figure 8.
Subjects' losses in gain compared with the optimal gain, in experiment 2. Conventions are as in Figure 5. Learning curves were fitted only to the data of sessions 2–5, after which the cost function was changed. Although subjects were exposed to a novel situation in session 6, losses did not increase between sessions 5 and 6, indicating that subjects used the knowledge they had gained about the jump distributions to immediately adjust their strategies to the new payoff situation. Actually, subjects seem to be better instead of worse with regard to their choices and overall performance after the switch, which might be attributable to higher motivation because of the new challenge. Note that, although for each subject the task version, and thus the optimal gain, changed between sessions 5 and 6, the average optimal gain across all subjects did not because, as before, four subjects saw one version of the task and four saw the other version. We therefore can compare average losses in sessions before and after the change without confounding the results with differences in optimal gain between the task versions.

