
Figure 2.
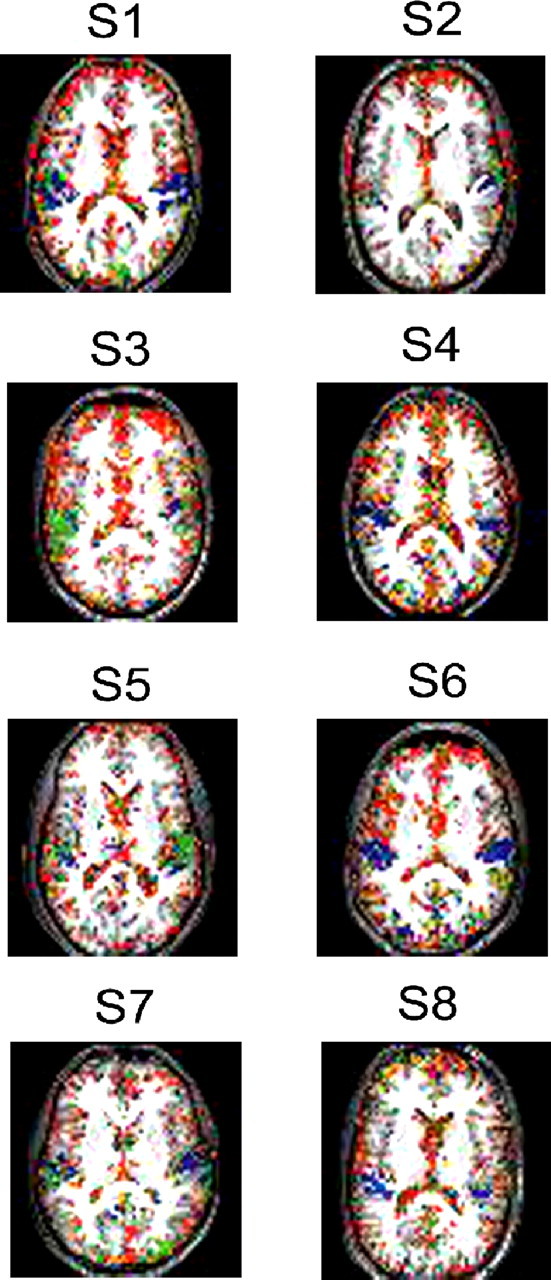
Temporal maps of preferred latencies for AV stimulation of eight representative subjects. Similar brain slices for all subjects are shown. Color coded is the time from AV stimulation, until the BOLD signal in a voxel becomes most informative about the preceding stimulus. Blue, Early AV stimulation response; red, late response. Only voxels in which the mutual information value was suprathreshold are shown.