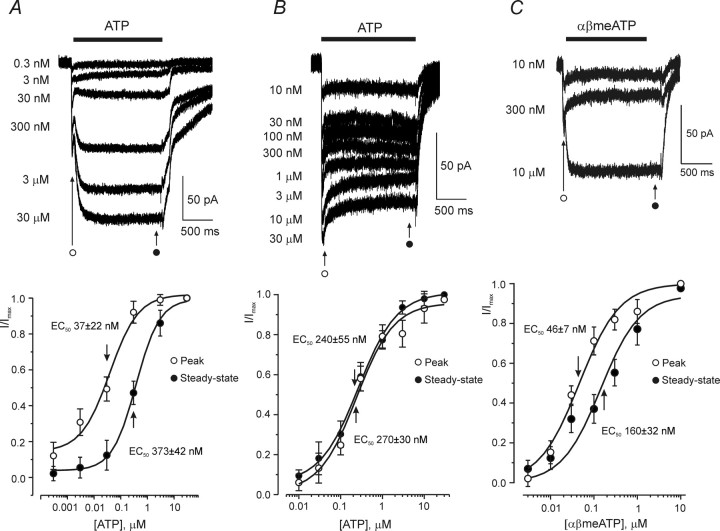
Figure 2.
Concentration dependence of ATP-induced currents in cortical astrocytes. A, Concentration dependence of peak and steady-state components of the type 1 ATP-induced response. Membrane currents recorded from a single cell in response to different ATP concentrations are shown on the top. The bottom shows the concentration–response curves constructed from nine similar experiments; current amplitudes were measured at the initial peak and at the end of the current, as indicated on the graph. B, Concentration dependence of the type 2 ATP-induced response. The family of membrane currents evoked by various ATP concentrations is shown on the top. The concentration–response curves constructed for the peak and steady-state of the ATP-induced currents (as indicated on the graph) recorded from eight cells are represented in the bottom. C, Membrane currents recorded from single astrocyte in response to different concentrations of αβmeATP are represented on the top; bottom shows the concentration–response curves for peak and steady-state currents; data were pooled from six experiments. All recordings were made at a holding potential of −80 mV.

