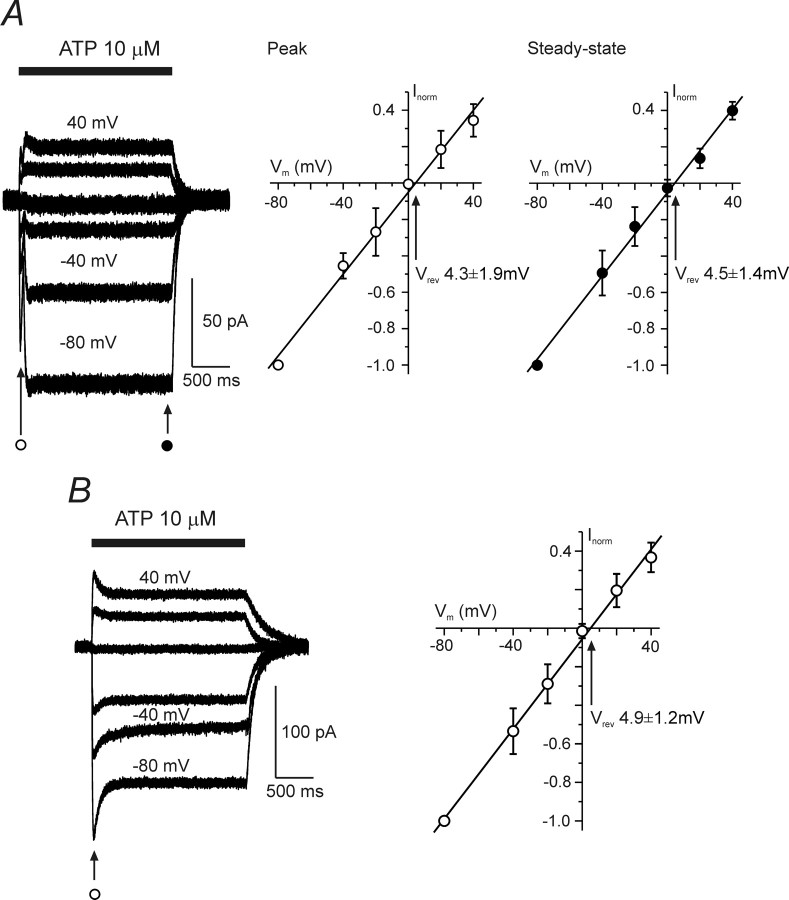
Figure 3.
Voltage dependence of the ATP-induced currents. A and B show the voltage dependence of the type 1 (A) and type 2 (B) ATP-induced currents. The left panels demonstrate families of ion currents evoked by ATP at holding potentials varying between −80 and 40 mV. Current–voltage plots for ATP-induced currents are shown on the right (A, n = 6; B, n = 7). The amplitudes of currents were normalized to the value measured at −80 mV.

