
Figure 1.
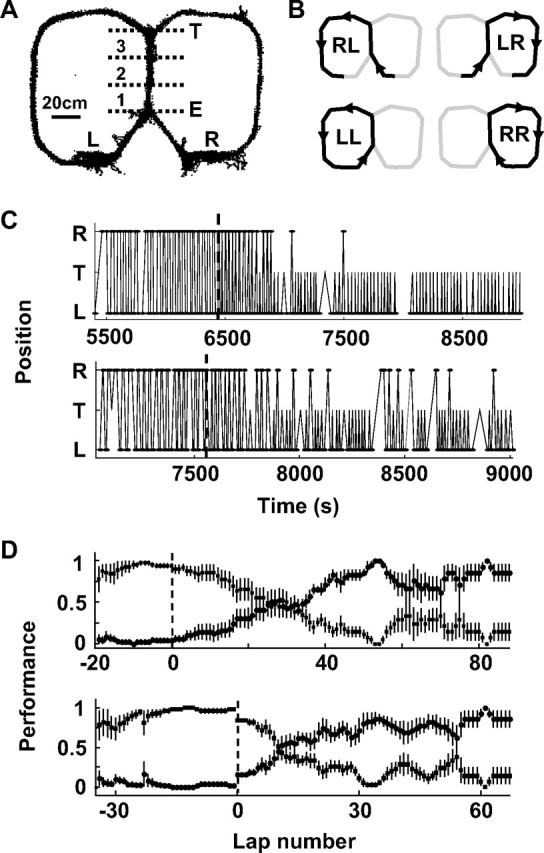
Behavioral task and performance. A, The figure-eight maze as shown in cumulative distribution of sampled locations during a typical switching session. Letters mark strategic points: L and R are the left and right reward sites, respectively; E and T are the entrance and exit of the central track, respectively. The central track was divided into three segments (1, 2, 3) for analysis. B, Schematic diagrams of running trajectories on the maze (RL, LR, LL, RR). Arrows mark running directions. C, Actual laps during two switching sessions (top and bottom, both switching from alternation LR/RL to LL). For each plot, the y-axis symbolically denotes three strategic points: L, T, and R. For example, an upward line L-T-R means an LR lap. Dashed line, Time at which reward at R was terminated. D, Average accuracy (mean ± SE), computed from all sessions, for alternation (LR/RL, ■) and unilateral (LL or RR, •) behavior. Different sessions were aligned (dashed line) either on their switching laps (top) or their actual first laps on new trajectories after the switch (bottom).