
Figure 2.
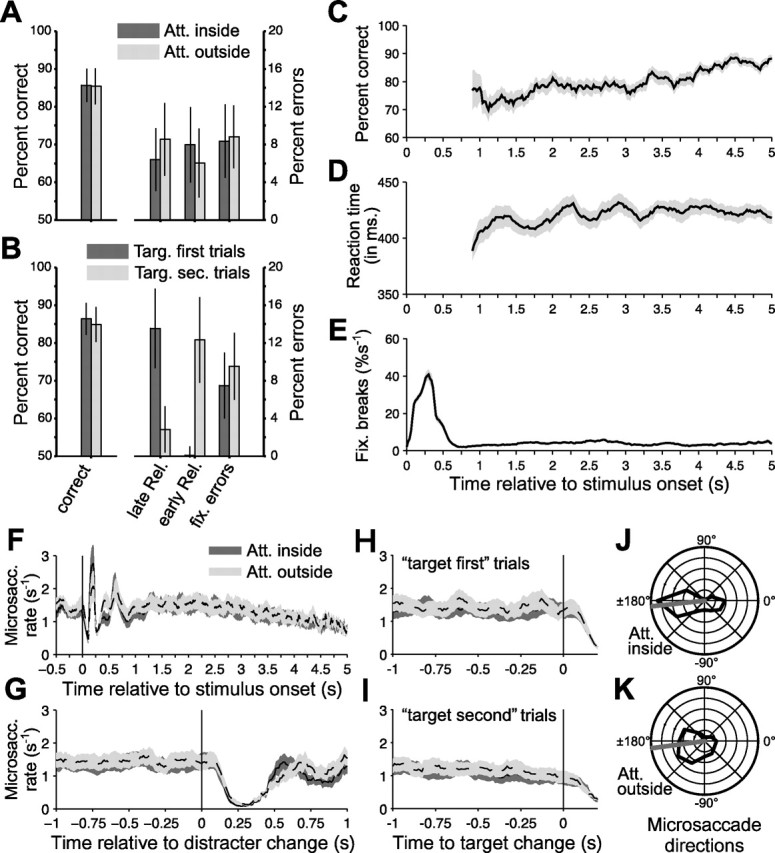
Detailed analysis of behavior. A, Left, Proportion bar releases (of all bar releases) that occurred within 0.15–0.65 s after a target change and were therefore classified as correct responses. Right, Proportion of bar releases that occurred too late or too early and of fixation breaks. Please note the two different y-axes for the left and right parts. The different shades of gray indicate trials with attention into or outside of the RF of the recorded neurons. Error bars denote the confidence range (i.e., the mean ± 1.96 SEM). B, Same analysis and format as in A, but with the trials split according to whether the target changed first or only after a distracter change. C, Proportion of correct responses as a function of time after stimulus onset. D, Behavioral response times as a function of time after stimulus onset. C and D use a sliding window of ±0.15 s. E, The rate of fixation breaks as a function of time after stimulus onset. The value shown gives the proportion of trials (as percentage of those trials that were still alive until that time after stimulus onset) that was terminated by fixation breaks. This proportion was estimated with a sliding ±0.15 s window but scaled to the rate per second. F–I, The rate of MSs as a function of time relative to stimulus onsets (F), distracter changes (G), target changes before distracter changes (H), and target changes after distracter changes (I). The MS rate was determined with a sliding window of ±0.05 s. All shaded regions around time courses show the mean ± 1 SEM. J, K, Distribution of MS directions and their mean. Att., Attention; Targ., target; Rel., release; fix., fixation; sec., second.