
Figure 5.
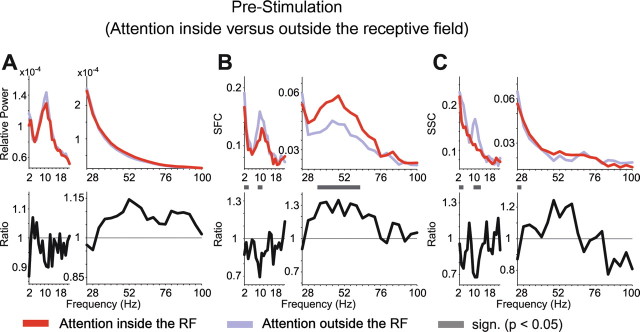
Attentional modulation of synchronization in the prestimulus period. The format is the same as in Figure 3, but showing the LFP power (A), SFC (B), and SSC (C) during the prestimulus interval, with attention directed inside (red) or outside (blue) the RF (top row) and the ratio between attentional conditions (bottom row).