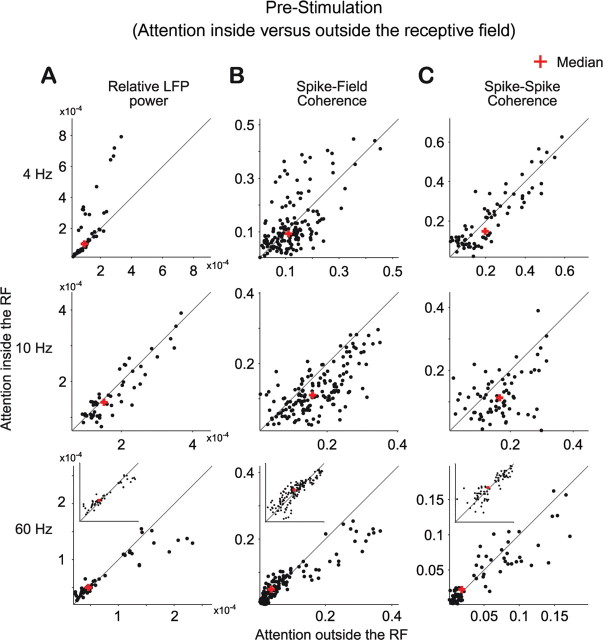
Figure 6.
Distribution of synchronization measures with attention inside versus outside the RF in the prestimulus period. A, Relative LFP power at 4 Hz (top), at 10 Hz (middle), and ∼60 Hz (bottom) with attention inside (y-axis) and outside (x-axis) the RF of the recorded neuronal population. B, C, The format is the same as in A, but showing the distribution of spike–field (B) and spike–spike (C) coherence. The red cross indicates the median of the respective distributions. The insets in the bottom panels show distributions in log–log scales with x- and y-axis limits identical to the respective larger panels to enhance visualization of the distribution around dense clusters of data points.

