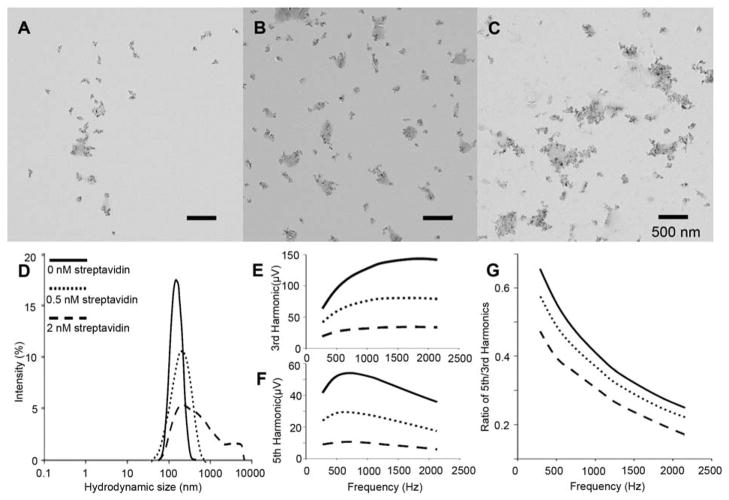
Fig. 1.
Characterization of mNP in three different bound states. A–C, TEM images of mNP with the addition of 0, 0.5 and 2 nM streptavidin, respectively; D, hydrodynamic size analysis of mNP in different bound states; E and F are MSB measurement of 3rd and 5th harmonics of mNP samples of different bound states; and G is the ratio of 5th and 3rd harmonics in F and E.

