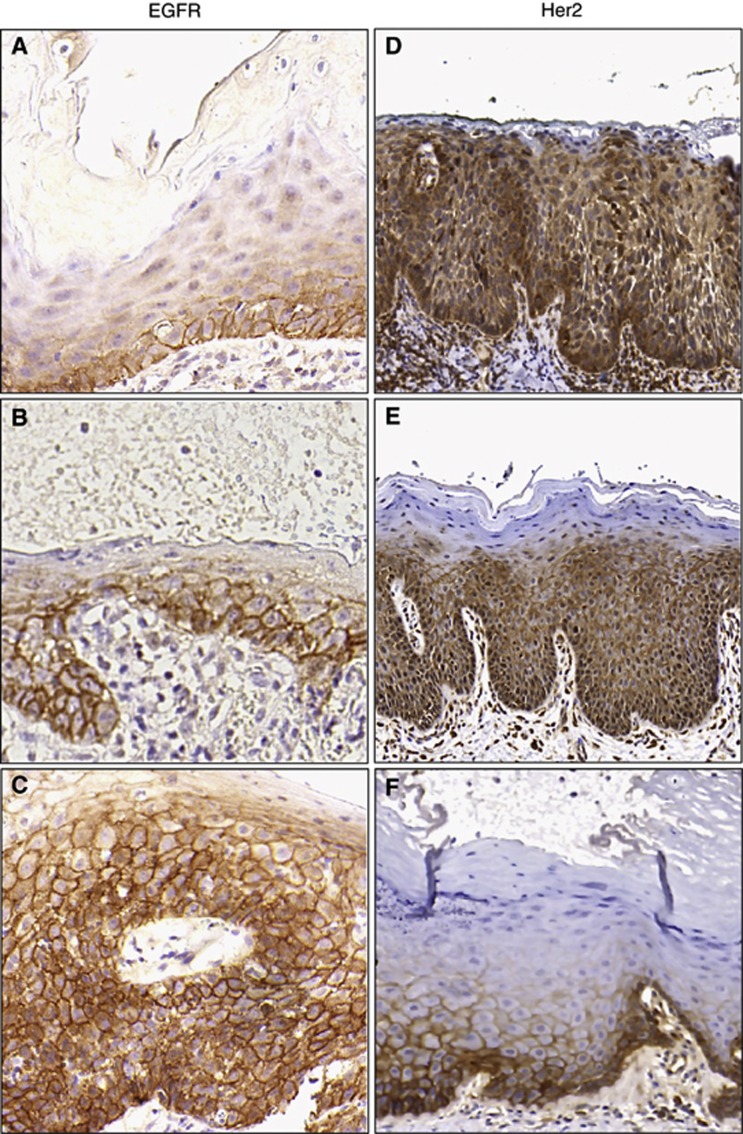
Figure 3.
Representative immunohistochemistry. Tiles (A–C) (EGFR) and (D–F) (Her2) display increasing expression from scores of 2 (top row), to 6 (middle row) to 12 (bottom row). The strongest her2 staining was scored as 3 out of 12 (F). Some cases demonstrated both cytoplasmic and membranous staining (E) and were considered as positive. Where only cytoplasmic staining occurred (D) this was considered as negative and given a score of 0.

