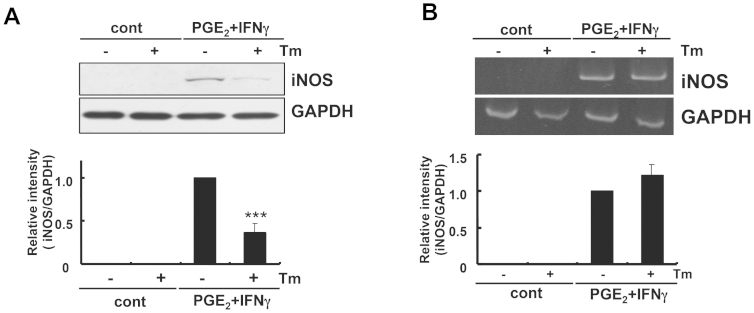
Figure 4. PGE2 + IFNγ-induced iNOS expression was inhibited at the protein level under ER stress.
(A) Glial cells were treated with tunicamycin (Tm: 1 μg/mL) for 1 h and then stimulated with PGE2 (15 μM) + IFNγ(20 ng/mL) for 24 h iNOS protein levels were detected by Western blotting. PGE2 + IFNγ-induced iNOS expression was inhibited under ER stress. ***p < 0.001 PGE2 + IFNγ v.s. PGE2 + IFNγ + Tm. n = 6. The GAPDH was analyzed as loading control. The intensities of the bands were expressed as iNOS/GAPDH. Full-length blots are presented in Supplementary Fig S5. (B) Glial cells were treated with tunicamycin (Tm: 1 μg/mL) for 1 h and then stimulated with PGE2 (15 μM) + IFNγ(20 ng/mL) for 4 h, and RT-PCR analysis was performed. PGE2 + IFNγ-induced iNOS expression at the mRNA level was not inhibited under ER stress. n = 6. The GAPDH was analyzed as loading control. Full-length gels are presented in Supplementary Fig S4. Cropped gels/blots were run under the same experimental conditions. Between the cont and PGE2 + IFNγ conditions for figure 4B (iNOS), cropped blots have been presented together for display purposes.

