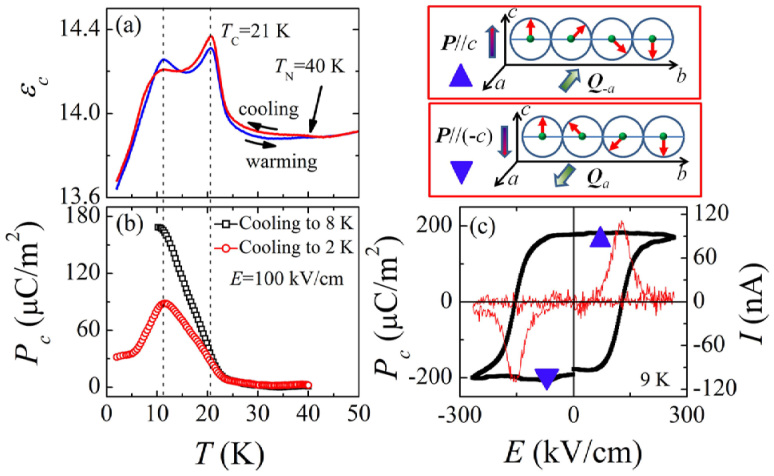
Figure 3.
Temperature dependence of εc (a) and Pc (b). The arrows in (a) indicate the directions of the heating or cooling processes. Red circles and black squares in (b) correspond to the results of different poling processes. In (c), ferroelectric hysteresis loop measured at T = 9 K without magnetic field during the cooling process. In the upper of (c), a sketch of the clockwise (Q−a) and counterclockwise (Qa) spiral spin orders is presented, corresponding to the +Pc and −Pc, respectively.

