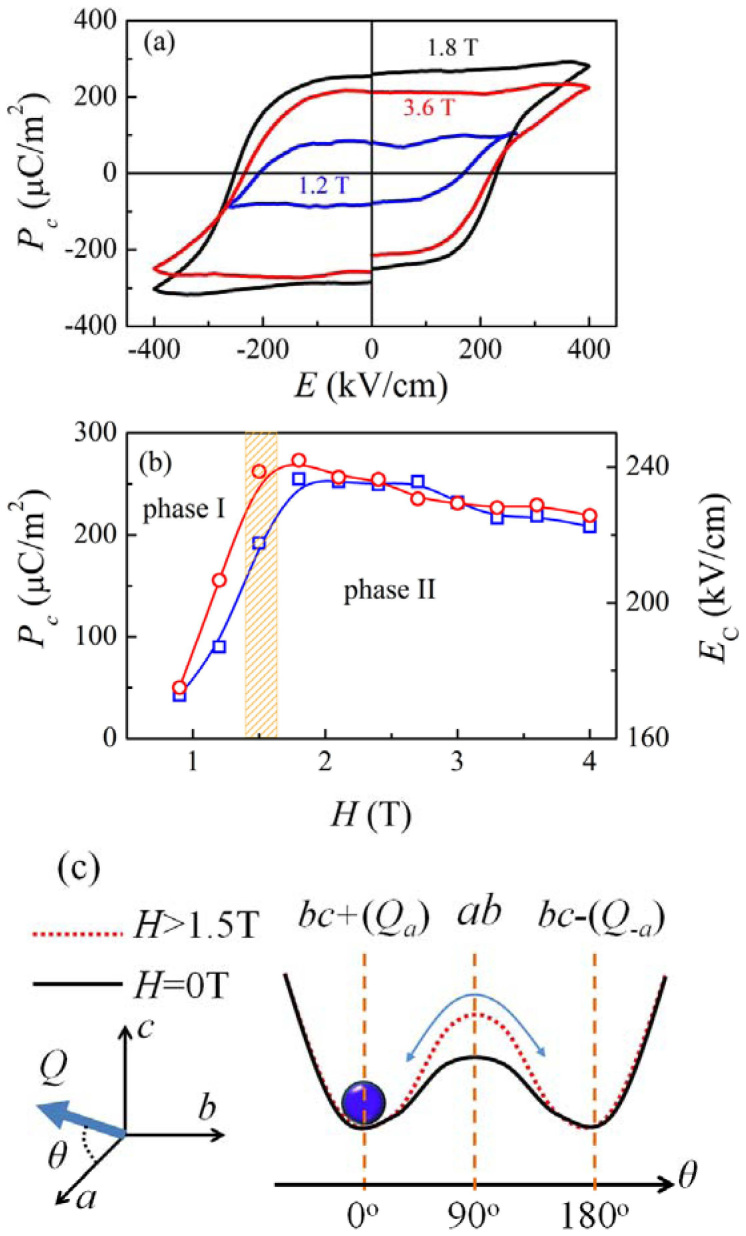
Figure 6.
(a) Ferroelectric hysteresis loops measured under various magnetic field at T = 5 K. (b) H dependence of the switching polarization Pc (open squares) and ferroelectric coercive field EC (open circles) measured using the PUND method. The orange hatched region denotes the magnetic field driven phase transition of Dy moment. (c) A sketch of the energy diagram on the ferroelectric switching process.

