
Figure 4.
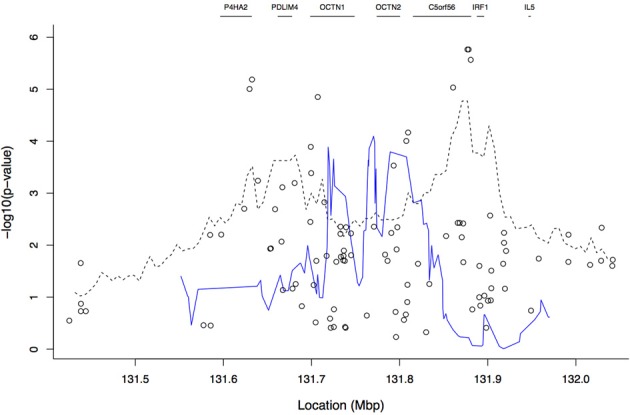
Plot of −log10 of the p-values from the TDTHAP analysis using a window size of 20 SNPs (blue solid line). The open circles and the dashed line give the single-SNP and tree-based results, respectively, that were also shown in Figure 3. Gene boundaries are marked by horizontal line segments at the top of the plot.