
Figure 5.
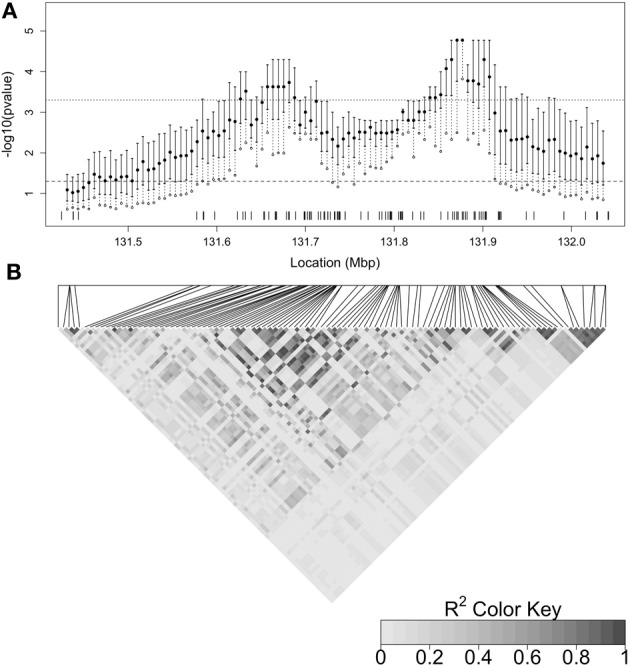
(A) Plot summarizing the distribution of the latent p-values by focal point. The inter-quartile range (IQR) of the latent p-values at each focal point is indicated by the solid vertical line. The filled in circle is the median and the open circle is the 90th percentile of the distribution. The dashed vertical line therefore indicates the range from the 75th to 90th percentile. The dashed horizontal line indicates a p-value cutoff of 0.05 and the dotted horizontal line shows a p-value cutoff of 0.0005 (0.05, Bonferroni-corrected for 100 focal points). SNP locations are marked by tickmarks at the base of the plot. (B) Heatmap of linkage disequilibrium (R2) between SNPs estimated from control haplotypes and displayed by LDheatmap (Shin et al., 2006). The relative positions of the SNPs are given by the horizontal line above the heatmap and the positions are aligned with (A).