
Figure 6.
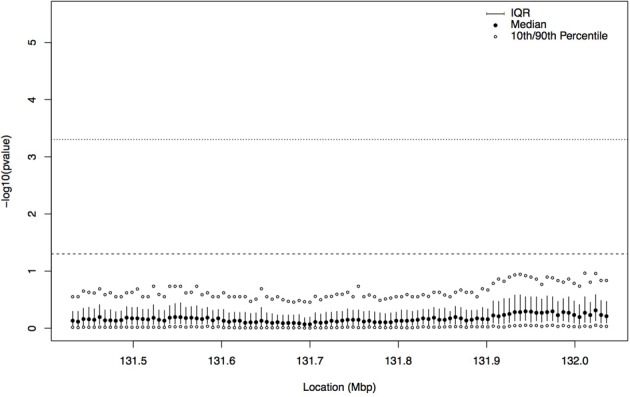
Plot summarizing the distribution of the latent p-values by focal point for the permuted case-control labels on haplotypes. The interquartile range (IQR) at each focal point is indicated by the solid vertical line, the filled in circle is the median, and the open circles represent the 10th and 90th percentiles of the distribution of −log10 of the latent p-values. The dashed horizontal line indicates a p-value cutoff of 0.05 and the dotted horizontal line shows a p-value cutoff of 0.0005 (Bonferroni corrected for 100 focal points). For all focal points, the 90th percentile of the distribution of −log10 of the latent p-values is below the 0.05 cutoff.