Figure 2.

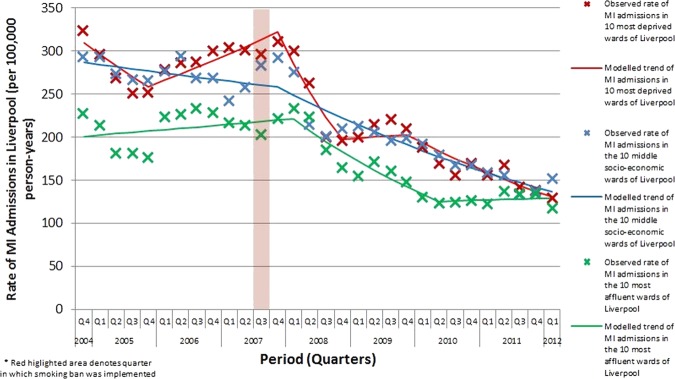
Observed and modelled rates for all myocardial infarction admissions in Liverpool, 2004–2012, subdivided into three socioeconomic groupings (the 10 most deprived wards, the 10 middle-ranked wards and the 10 most affluent wards).

Observed and modelled rates for all myocardial infarction admissions in Liverpool, 2004–2012, subdivided into three socioeconomic groupings (the 10 most deprived wards, the 10 middle-ranked wards and the 10 most affluent wards).