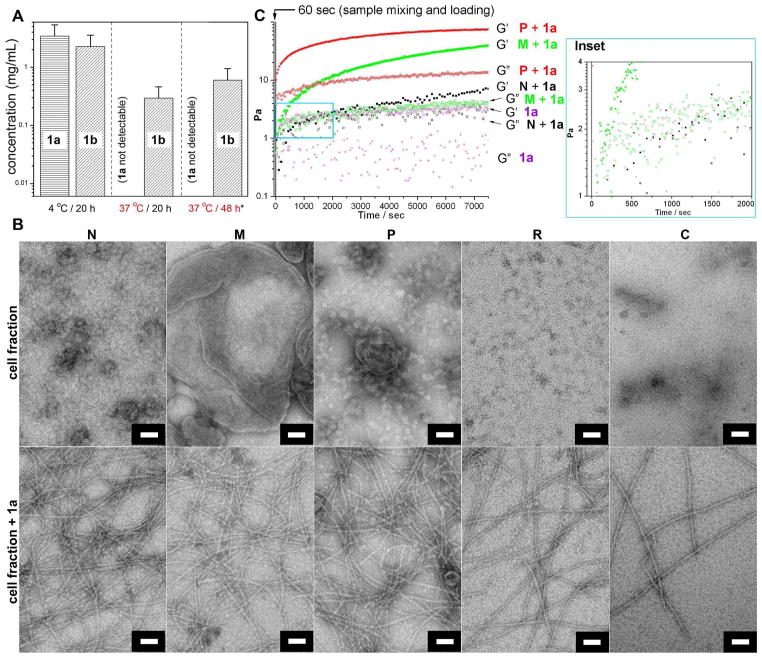
Figure 2.
(A) The average intracellular concentrations of precursor 1a and hydrogelator 1b were determined by LC-MS after incubating HeLa cells with precursor 1a at concentration of 500 μM and temperatures of 4 °C or 37 °C up to two days (*These cells were co-incubated with additional 2a at the concentration of 200 nM). (B) Typical TEM images showing the morphology of each cell fraction itself and with the addition of 1a at the concentration of 6 mg/mL after 24h (for N, M, and P) and 48h (for R and C). Scale bar: 500 nm for cell fraction N and 50 nm for the rest. (C) The storage/loss modulus measurement at a time mode by oscillatory rheometry showing the gelation points of the mixture of each cell fraction with 1a at the concentration of 6 mg/mL; (Inset) Enlarged area boxed by the blue lines in (C).

